/**
* This object contains a helper method for creating a renderer for exploring the relationship between two numeric attributes.
* This is commonly known as a [bivariate choropleth](https://www.joshuastevens.net/cartography/make-a-bivariate-choropleth-map/)
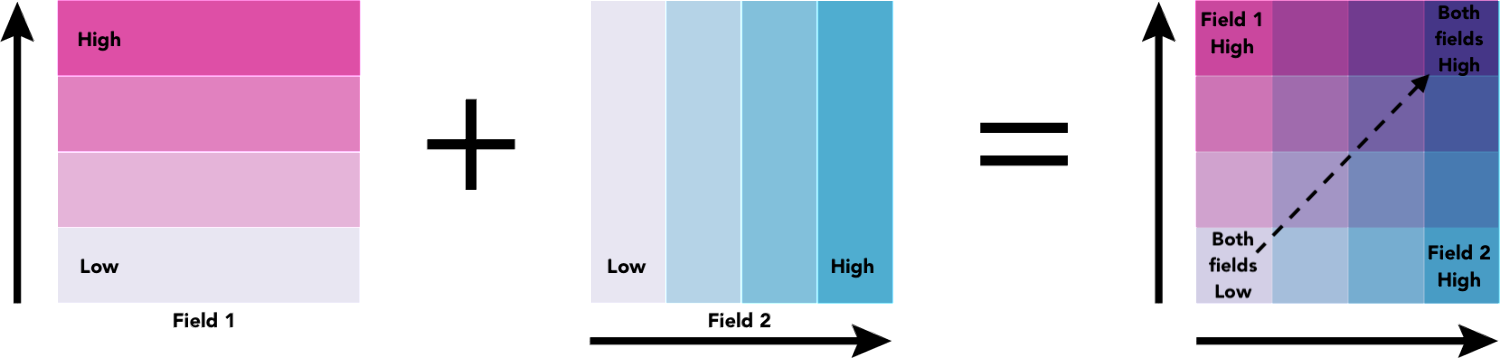
* visualization. This renderer classifies each variable in either 2, 3, or 4 classes along separate color ramps. One of those ramps
* is rotated 90 degrees and overlaid on the other to create a 2x2, 3x3, or 4x4 square grid. The x-axis indicates the range of
* values for one variable, and the y-axis indicates the range for the second variable. The squares running diagonal from the
* lower left corner to the upper right corner indicate features where the two variables may be related or in agreement with one
* another.
*
*
*
*
* The legend of a relationship renderer resembles a grid of two single-hue sequential color ramps overlaid on each other, forming a third
* hue along a diagonal line, which indicates where the two variables could potentially be related.
*
*
*
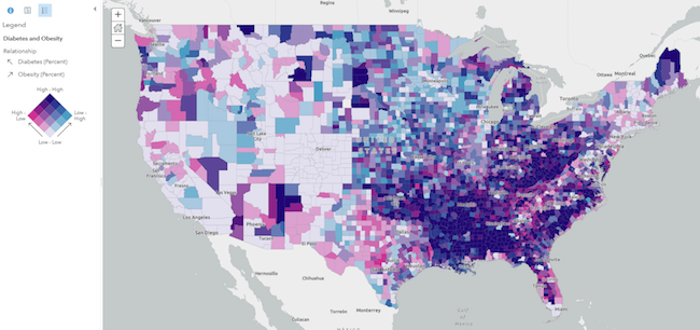
* The lower right and upper left corners indicate features where one field has high values and the other field low values and
* vice versa. The image below shows what this style looks like on a map of U.S. counties where the percent of the population diagnosed
* with Diabetes is compared to the percent of the population that is obese.
*
* [](https://www.arcgis.com/home/webmap/viewer.html?webmap=c09aee5d3fee41c489fdffec21cb270a)
*
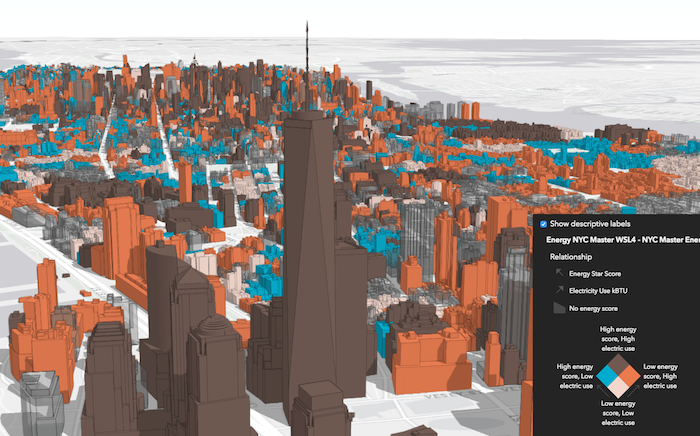
* While this visualization style was originally designed for 2D choropleth maps, it is particularly useful in 3D scenes where
* bivariate visualizations of color and size would not otherwise be possible since the size of features is reserved for real-world sizes of objects,
* such as buildings. Therefore, the relationship renderer becomes ideal for creating thematic bivariate visualizations of
* 3d object [SceneLayers](https://developers.arcgis.com/javascript/latest/references/core/layers/SceneLayer/).
*
* [](https://developers.arcgis.com/javascript/latest/sample-code/visualization-sm-relationship/)
*
* Keep in mind that even if you observe a positive relationship between the two variables of interest, it doesn't mean they
* are statistically correlated. It also doesn't imply the presence of one variable influences the other. Therefore, this
* renderer should be used judiciously with some prior knowledge that two variables may likely be related.
*
* > [!WARNING]
* >
* > **Known Limitations**
* >
* > [SceneLayers](https://developers.arcgis.com/javascript/latest/references/core/layers/SceneLayer/) must have the `supportsRenderer` and `supportsLayerQuery` capabilities enabled unless a predefined [statistics](https://developers.arcgis.com/javascript/latest/references/core/smartMapping/statistics/types/#SummaryStatisticsResult) object is provided to the `statistics` parameter of the method. To check a SceneLayer's capabilities, use the [SceneLayer.getFieldUsageInfo()](https://developers.arcgis.com/javascript/latest/references/core/layers/SceneLayer/#getFieldUsageInfo) method.
*
* @since 4.9
* @see [Samples - Generate a relationship visualization](https://developers.arcgis.com/javascript/latest/sample-code/visualization-sm-relationship/)
* @see [ArcGIS Blog - What is a Relationship Map?](https://www.esri.com/arcgis-blog/products/arcgis-online/mapping/what-is-a-relationship-map/)
* @see [ArcGIS Blog - How to Make a Relationship Map in ArcGIS Online](https://www.esri.com/arcgis-blog/products/arcgis-online/mapping/how-to-make-a-relationship-map-in-arcgis-online/)
* @see [Bivariate Choropleth Maps: A How-to Guide](https://www.joshuastevens.net/cartography/make-a-bivariate-choropleth-map/)
* @see [Wikipedia - Bivariate map](https://en.wikipedia.org/wiki/Bivariate_map)
* @see [Styles and data visualization](https://developers.arcgis.com/javascript/latest/visualization/)
*/
import type Color from "../../Color.js";
import type FeatureFilter from "../../layers/support/FeatureFilter.js";
import type UniqueValueRenderer from "../../renderers/UniqueValueRenderer.js";
import type { MapViewOrSceneView } from "../../views/MapViewOrSceneView.js";
import type { AbortOptions } from "../../core/promiseUtils.js";
import type { RelationshipNumClasses } from "../../renderers/types.js";
import type { RendererLegendOptionsProperties } from "../../renderers/support/RendererLegendOptions.js";
import type { UniqueValueInfo } from "./type.js";
import type { ClassBreak, ClassBreaksResult } from "../statistics/types.js";
import type { FeatureLikeLayerOrAdapter } from "../support/adapters/types.js";
import type { RelationshipScheme, BasemapTheme } from "../symbology/types.js";
/**
* Updates a relationship renderer (bivariate choropleth) generated from [createRenderer()](https://developers.arcgis.com/javascript/latest/references/core/smartMapping/renderers/relationship/#createRenderer)
* based on the given input parameters.
*
* @param parameters - Input parameters for updating a relationship visualization created in [createRenderer()](https://developers.arcgis.com/javascript/latest/references/core/smartMapping/renderers/relationship/#createRenderer).
* @returns Resolves to the updated relationship renderer.
*/
export function updateRenderer(parameters: UpdateRendererParameters): Promise;
/**
* Generates a relationship renderer (bivariate choropleth) based on a set of competing numeric fields.
*
* Each feature's category is determined based on the result of an Arcade expression generated internally
* by this method. You are required provide a `layer`, `view`, `field1` name, and `field2` name to generate this renderer. Optionally, you can
* set the `focus` to change the rotation of the legend and the `numClasses` parameter to change the grid size of the legend.
*
* Other options are provided for convenience for more involved custom visualization authoring
* applications.
*
* @param parameters - Input parameters for generating a relationship visualization based on a pair of numeric field(s).
* @returns Resolves to an instance of [RendererResult](https://developers.arcgis.com/javascript/latest/references/core/smartMapping/renderers/relationship/#RendererResult).
* @example
* const layer = new FeatureLayer({
* url: "https://services.arcgis.com/..."
* });
*
* // will create a bivariate choropleth visualization exploring the relationship
* // between the % of the population classified as obese, and the %
* // of the population diagnosed with diabetes
*
* const parameters = {
* layer: layer,
* view: view,
* field1: {
* field: "POP_Diabetes",
* normalizationField: "TOTAL_POP"
* },
* field2: {
* field: "POP_Obesity",
* normalizationField: "TOTAL_POP"
* },
* focus: "HH",
* defaultSymbolEnabled: false
* };
*
* // when the promise resolves, apply the renderer to the layer
* relationshipRendererCreator.createRenderer(parameters)
* .then(function(response){
* layer.renderer = response.renderer;
* });
*/
export function createRenderer(parameters: RendererParameters): Promise;
export type SymbolType = "2d" | "3d-flat" | "3d-volumetric" | "3d-volumetric-uniform";
export type ColorMixModeType = "tint" | "replace" | "multiply";
export type FocusType = "HH" | "HL" | "LH" | "LL";
export interface FieldInfo {
/** The name of a numeric field. */
field: string;
/**
* The name of a numeric field used to normalize the given `field`. In choropleth visualizations
* it is best practice to normalize your data values if they haven't already been normalized.
*/
normalizationField?: string;
/** The label used to describe the field or variable in the legend. */
label?: string;
/**
* The maximum bound of values to visualize in the given field. If a feature's value is greater than
* this value, then it will be assigned the default symbol of the renderer.
*/
maxValue?: number;
/**
* The minimum bound of values to visualize in the given field. If a feature's value is less than
* this value, then it will be assigned the default symbol of the renderer.
*/
minValue?: number;
}
export interface RendererParameters extends AbortOptions {
/**
* The layer
* for which the visualization is generated. When a client-side layer type is provided, attribute and spatial statistics are calculated
* only from features in the view's extent. When a server-side layer type is provided, the statistics
* are calculated from the entire layer.
*/
layer?: FeatureLikeLayerOrAdapter | null;
/**
* A numeric field that will be used to explore its relationship with `field2`. In the default visualization,
* the values of this field are rendered along the vertical axis of the [Legend](https://developers.arcgis.com/javascript/latest/references/map-components/components/arcgis-legend/).
*/
field1?: FieldInfo | null;
/**
* A numeric field that will be used to explore its relationship with `field1`. In the default visualization,
* the values of this field are rendered along the horizontal axis of the [Legend](https://developers.arcgis.com/javascript/latest/references/map-components/components/arcgis-legend/).
*/
field2?: FieldInfo | null;
/**
* The method for classifying each field's data values. See
* [classBreaks()](https://developers.arcgis.com/javascript/latest/references/core/smartMapping/statistics/classBreaks/#classBreaks) for more information
* about each classification type.
*
* @default quantile
*/
classificationMethod?: "equal-interval" | "natural-breaks" | "quantile";
/**
* Determines the orientation of the [Legend](https://developers.arcgis.com/javascript/latest/references/map-components/components/arcgis-legend/). This value does not change the renderer or symbology
* of any features in the layer. This affects the legend only. See the table below for a description of the possible values. See the class description
* at the top of this page for a more thorough explanation of how to read the legend.
*
* Value | Example | Description
* ------|-------------|--------
* null | 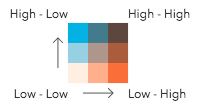 | The legend renders as a square. The top right corner of the legend indicates that values from both `field1` and `field2` are considered high. |
* HH | 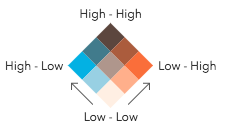 | The legend renders as a diamond with the focus on the top corner where values from both `field1` and `field2` are considered high. |
* HL | 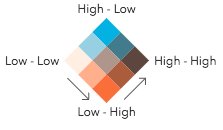 | The legend renders as a diamond with the focus on the top corner where values from `field1` are high and values from `field2` are low. |
* LH | 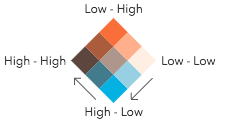 | The legend renders as a diamond with the focus on the top corner where values from `field1` are low and values from `field2` are high. |
* LL | 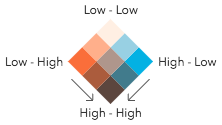 | The legend renders as a diamond with the focus on the top corner where values from both `field1` and `field2` are considered low. |
*
* @default null
*/
focus?: FocusType | null;
/**
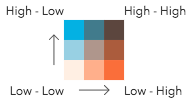
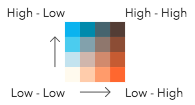
* Indicates the number of classes by which to break up the values of each field. More classes give you more detail, but more colors, making the visualization
* more difficult to understand. There are only three possible values.
*
* 2 classes | 3 classes | 4 classes
* --|--|---
* 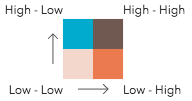 |  | 
*
* **Possible Values:** 2 | 3 | 4
*
* @default 3
*/
numClasses?: RelationshipNumClasses | null;
/**
* Provides options for modifying [Legend](https://developers.arcgis.com/javascript/latest/references/map-components/components/arcgis-legend/) properties describing
* the visualization.
*/
legendOptions?: RendererLegendOptionsProperties | null;
/**
* In authoring apps,
* the user may select a pre-defined relationship scheme. Pass the scheme object to this property to avoid getting one based on the background of the `view`.
*/
relationshipScheme?: RelationshipScheme | null;
/**
* Enables the `defaultSymbol` on the renderer and assigns it to features
* with no value or that fall outside of the prescribed class breaks.
*
* @default true
*/
defaultSymbolEnabled?: boolean | null;
/**
* For polygon layers only. Indicates whether the
* polygon outline width should vary based on view scale. When set, a valid [MapView](https://developers.arcgis.com/javascript/latest/references/core/views/MapView/)
* instance must be provided in the `view` parameter. This option is not supported for 3D
* [SceneViews](https://developers.arcgis.com/javascript/latest/references/core/views/SceneView/).
*
* @default false
*/
outlineOptimizationEnabled?: boolean | null;
/**
* For point and polyline layers only. Indicates whether
* symbol sizes should vary based on view scale. When set, a valid [MapView](https://developers.arcgis.com/javascript/latest/references/core/views/MapView/)
* instance must be provided in the `view` parameter. This option is not supported for 3D
* [SceneViews](https://developers.arcgis.com/javascript/latest/references/core/views/SceneView/).
*
* @default false
*/
sizeOptimizationEnabled?: boolean | null;
/**
* Indicates whether the generated renderer is for a binning or clustering visualization.
* If `true`, then the input field(s) in this method should refer to [aggregate fields](https://developers.arcgis.com/javascript/latest/references/core/layers/support/AggregateField/) defined in the `featureReduction` property of the layer.
*/
forBinning?: boolean | null;
/**
* When defined, only features included in the filter
* are considered in the attribute and spatial statistics calculations when determining the final renderer.
* This is useful when a lot of variation exists in the data
* that could result in undesired data ranges. A common use case would be to set a filter that only
* includes features in the current extent of the view where the data is most likely to be viewed. Currently, only
* geometry filters with an `intersects` spatial relationship are supported. All other filter types (including `where`) are ignored.
*
* @since 4.31
*/
filter?: FeatureFilter | null;
/**
* The type of symbol to generate. This depends on the view
* in which you are working and the desired visualization. This parameter does not need to be specified for layers
* with a `mesh` geometry type. Possible values are described below.
*
* | Value | Description |
* | ----- | ----------- |
* | 2d | Generates a visualization using 2D symbols such as [SimpleMarkerSymbol](https://developers.arcgis.com/javascript/latest/references/core/symbols/SimpleMarkerSymbol/), [SimpleLineSymbol](https://developers.arcgis.com/javascript/latest/references/core/symbols/SimpleLineSymbol/), or [SimpleFillSymbol](https://developers.arcgis.com/javascript/latest/references/core/symbols/SimpleFillSymbol/). Use this option if generating a visualization for data in a [MapView](https://developers.arcgis.com/javascript/latest/references/core/views/MapView/). |
* | 3d-flat | Generates a visualization using 3D symbols with flat symbol layers such as [IconSymbol3DLayer](https://developers.arcgis.com/javascript/latest/references/core/symbols/IconSymbol3DLayer/), [LineSymbol3DLayer](https://developers.arcgis.com/javascript/latest/references/core/symbols/LineSymbol3DLayer/), or [FillSymbol3DLayer](https://developers.arcgis.com/javascript/latest/references/core/symbols/FillSymbol3DLayer/). Use this option if generating a 2D visualization for data in a [SceneView](https://developers.arcgis.com/javascript/latest/references/core/views/SceneView/). |
* | 3d-volumetric | Generates a visualization using 3D symbols with volumetric symbol layers such as [ObjectSymbol3DLayer](https://developers.arcgis.com/javascript/latest/references/core/symbols/ObjectSymbol3DLayer/), [PathSymbol3DLayer](https://developers.arcgis.com/javascript/latest/references/core/symbols/PathSymbol3DLayer/), or [ExtrudeSymbol3DLayer](https://developers.arcgis.com/javascript/latest/references/core/symbols/ExtrudeSymbol3DLayer/). Use this option if generating a 3D visualization for data in a [SceneView](https://developers.arcgis.com/javascript/latest/references/core/views/SceneView/). A SceneView instance must be provided to the `view` parameter if this option is used. |
* | 3d-volumetric-uniform | Generates a visualization using uniformly sized 3D symbols with volumetric symbol layers. Use this option if generating a 3D visualization for data in a [SceneView](https://developers.arcgis.com/javascript/latest/references/core/views/SceneView/) and the symbol should be sizes uniformly, for example with spheres. A SceneView instance must be provided to the `view` parameter if this option is used. |
*
* @default 2d
*/
symbolType?: SymbolType | null;
/**
* **This option only applies to generating renderers for mesh SceneLayers**.
* Specifies how the symbol's color is applied to the geometry color/texture. See the documentation in
* [FillSymbol3DLayer.material](https://developers.arcgis.com/javascript/latest/references/core/symbols/FillSymbol3DLayer/#material) for more context.
* See the table below for possible values.
*
* Value | Description
* ------|------------
* tint | Applies the symbol `color` to the desaturated geometry/texture color.
* replace | Removes the geometry/texture color and applies the symbol `color`.
* multiply | Multiplies geometry/texture color value with the symbol `color` value. The result is a darker color. Multiplying with white keeps the geometry color the same.
*
* @default replace
*/
colorMixMode?: ColorMixModeType | null;
/** The view instance in which the visualization will be rendered. */
view: MapViewOrSceneView | null;
}
export interface ClassBreaksInfo {
/** The class breaks generated for values in the `field1` parameter. */
field1: ClassBreaksResult;
/** The class breaks generated for values in the `field2` parameter. */
field2: ClassBreaksResult;
}
/**
* The result object of the [createRenderer()](https://developers.arcgis.com/javascript/latest/references/core/smartMapping/renderers/relationship/#createRenderer) method. See the table
* below for details of each property.
*/
export interface RendererResult {
/**
* The renderer object representing
* the relationship visualization. Set this on a layer's `renderer` property to update its visualization.
*/
renderer: UniqueValueRenderer;
/** Describes each class break for both fields considered in the relationship visualization. */
classBreaks: ClassBreaksInfo;
/**
* Describes each
* container or bin used in the visualization. Each unique value info object describes a class break for `field1`
* and `field2`. Therefore, features with the same color fall share will have values that fall in the same class break
* for `field1` and the same class break for `field2`.
*/
uniqueValueInfos: UniqueValueInfo[];
/** The relationship scheme used by the renderer. */
relationshipScheme: RelationshipScheme;
/** The ID of the basemap used to determine the optimal fill colors of the features. */
basemapId?: string | null;
/** Indicates whether the average color of the input view's basemap is `light` or `dark`. */
basemapTheme?: BasemapTheme | null;
}
export interface UpdateParamsFieldInfo {
/** The name of a numeric field. */
field: string;
/**
* The name of a numeric field used to normalize the given `field`. In choropleth visualizations
* it is best practice to normalize your data values if they haven't already been normalized.
*/
normalizationField?: string;
/** The label used to describe the field or variable in the legend. */
label?: string;
/**
* The class breaks
* for the field used in the relationship visualization.
*/
classBreakInfos: ClassBreak[];
}
export interface UpdateRendererParameters {
/**
* A numeric field used to explore its relationship with `field2`. In the default visualization,
* the values of this field are rendered along the vertical axis of the [Legend](https://developers.arcgis.com/javascript/latest/references/map-components/components/arcgis-legend/).
*/
field1?: UpdateParamsFieldInfo | null;
/**
* A numeric field used to explore its relationship with `field1`. In the default visualization,
* the values of this field are rendered along the horizontal axis of the [Legend](https://developers.arcgis.com/javascript/latest/references/map-components/components/arcgis-legend/).
*/
field2?: UpdateParamsFieldInfo | null;
/**
* The relationship renderer (generated from [createRenderer()](https://developers.arcgis.com/javascript/latest/references/core/smartMapping/renderers/relationship/#createRenderer))
* to update with the other parameters provided in this method.
*/
renderer?: UniqueValueRenderer | null;
/**
* Indicates the number of classes by which to break up the values of each field. More classes give you more detail, but more colors, making the visualization
* more difficult to understand. There are only three possible values.
*
* 2 classes | 3 classes | 4 classes
* --|--|---
*  |  | 
*
* **Possible Values:** 2 | 3 | 4
*/
numClasses?: RelationshipNumClasses | null;
/**
* Determines the orientation of the [Legend](https://developers.arcgis.com/javascript/latest/references/map-components/components/arcgis-legend/). This value does not change the renderer or symbology
* of any features in the layer. This affects the legend only. See the table below for a description of the possible values. See the class description
* at the top of this page for a more thorough explanation of how to read the legend.
*
* Value | Example | Description
* ------|-------------|--------
* null |  | The legend renders as a square. The top right corner of the legend indicates that values from both `field1` and `field2` are considered high. |
* HH |  | The legend renders as a diamond with the focus on the top corner where values from both `field1` and `field2` are considered high. |
* HL |  | The legend renders as a diamond with the focus on the top corner where values from `field1` are high and values from `field2` are low. |
* LH |  | The legend renders as a diamond with the focus on the top corner where values from `field1` are low and values from `field2` are high. |
* LL |  | The legend renders as a diamond with the focus on the top corner where values from both `field1` and `field2` are considered low. |
*
* @default null
*/
focus?: FocusType | null;
/** The array of colors to be used by the symbols in the uniqueValueInfos of the renderer. */
colors?: Color[] | null;
}
 *
*