# google-chart
A chart library made by google for creating charts. Use below library to create wide variety of charts with the help of google charts library.
See the official Documentation: [https://developers.google.com/chart/interactive/docs/quick_start](https://developers.google.com/chart/interactive/docs/quick_start)
I have used this above library to make a npm install package so that I can create some demo charts using this npm package.

## Installation
You can install google-chart using the following command:
```bash
npm install @arjunshinde/google-chart --save
```
---
---
## Working with Angular
Here is a simple example of how to use **google-chart** in Angular using **`bar chart`**
### 1. Add the path of library to the angular.json file
Open **`Angular.json`** file in your project and paste the following line in **`scripts`** section.
```bash
./node_modules/@arjunshinde/google-chart/google-chart.min.js
```
---
### 2. Create a new component & Initialize the component
In your **root project folder** of your angular application, create a new component.
```bash
ng g c bar-chart
```
Open the **`app.component.html`** file and paste the following code in it.
```html
```
---
### 3. Add view part of bar-chart component
Open the **`bar-chart.component.html`** file and paste the following code.
```html
```
---
### 4. Add the controller part of bar-chart component
Open the **`bar-chart.component.ts`** file and paste the following code.
```ts
import { Component, OnInit } from '@angular/core';
declare var google: any;
@Component({
selector: 'app-bar-chart',
templateUrl: './bar-chart.component.html',
styleUrls: ['./bar-chart.component.scss'],
})
export class BarChartComponent implements OnInit {
constructor() {}
ngOnInit(): void {
// Initialize the google charts
google.charts.load('current', { packages: ['corechart'] });
google.charts.setOnLoadCallback(this.drawChart);
}
// drawChart function
drawChart() {
// prepare the data
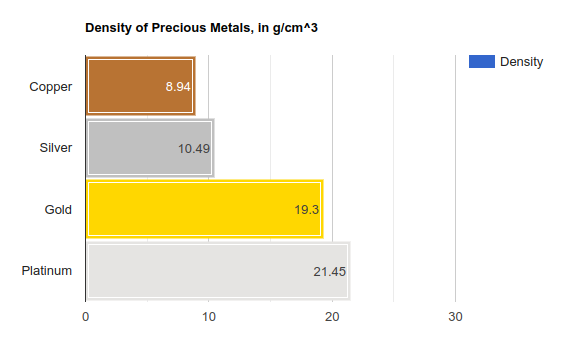
var data = google.visualization.arrayToDataTable([
['Element', 'Density', { role: 'style' }],
['Copper', 8.94, '#b87333'],
['Silver', 10.49, 'silver'],
['Gold', 19.3, 'gold'],
['Platinum', 21.45, 'color: #e5e4e2'],
]);
let view = new google.visualization.DataView(data);
view.setColumns([
0,
1,
{
calc: 'stringify',
sourceColumn: 1,
type: 'string',
role: 'annotation',
},
2,
]);
// customize the chart
let options = {
title: 'Density of Precious Metals, in g/cm^3',
width: 600,
height: 400,
bar: { groupWidth: '95%' },
// legend: { position: 'none' },
};
// draw the chart
let chart = new google.visualization.BarChart(
document.getElementById('canvas_barChart')
);
chart.draw(view, options);
}
}
```
---
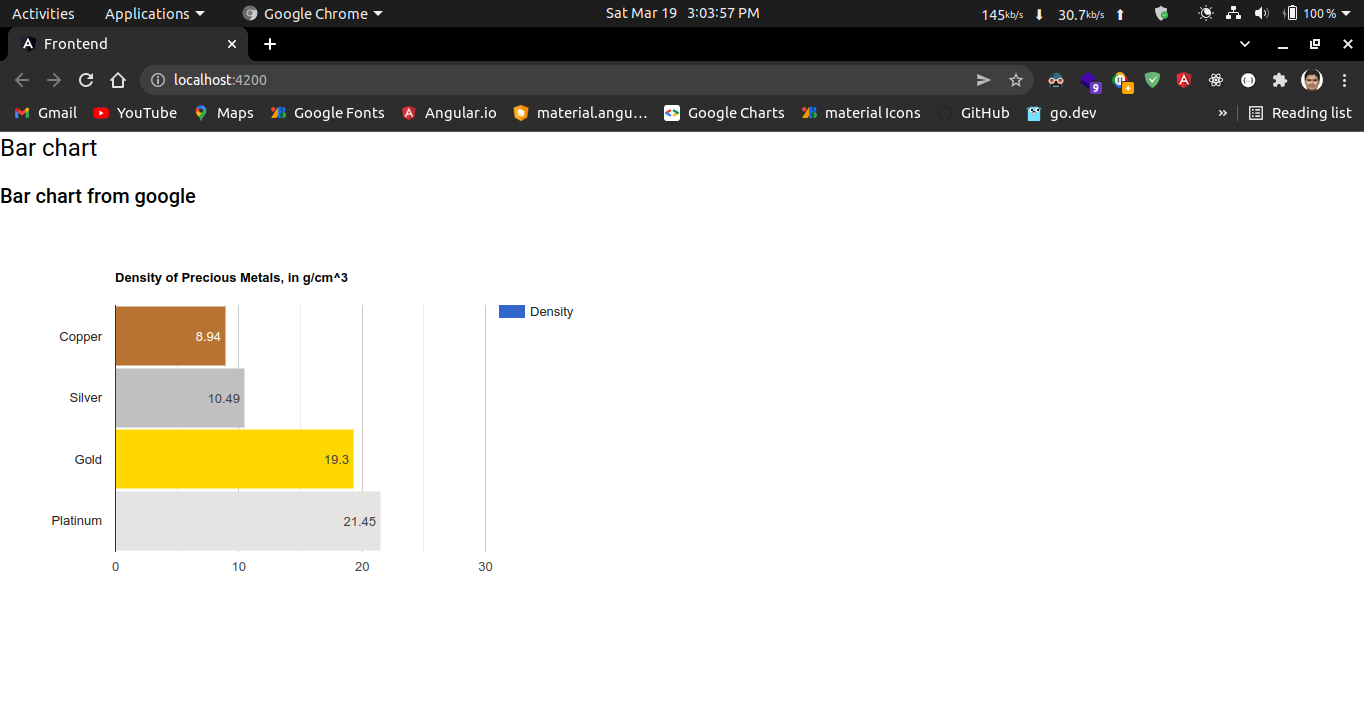
### 5. Run the angular project
```bash
ng serve -o
```
Open the **`localhost:4200`** URL in your browser.
---
---
## Usage demo Sample chart
Below is a sample chart that you can use to test the library.
---
---