# d3fc-series
A collection of components for rendering data series to SVG, canvas and WebGL, including line, bar, OHLC, candlestick and more.
[Main D3FC package](https://github.com/d3fc/d3fc)
## Installing
```bash
npm install @d3fc/d3fc-series
```
## API Reference
* [General API](#general-api)
* [SVG Rendering](#svg-rendering)
* [Canvas Rendering](#canvas-rendering)
* [WebGL Rendering](#webgl-rendering)
* [Decorate Pattern](#decorate-pattern)
* [Orientation](#orientation)
* [Multi Series](#multi-series)
* [Auto Bandwidth](#auto-bandwidth)
* [Accessors](#accessors)
* [Line](#line)
* [Point](#point)
* [Area](#area)
* [Bar](#bar)
* [Candlestick](#candlestick)
* [OHLC](#ohlc)
* [Boxplot](#boxplot)
* [Errorbar](#errorbar)
* [Heatmap](#heatmap)
* [Multi](#multi)
* [Repeat](#repeat)
* [Grouped](#grouped)
* [Stacked](#stacked)
This package contains a number of D3 components that render various standard series types. They all share a common API, with the typical configuration requiring x and y scales together with a number of value accessors. There are SVG, Canvas and WebGL versions of each series type, sharing the same configuration properties.
### General API
#### SVG rendering
In order to render a line series to SVG, the data should be supplied via a data-join or `datum`, as follows:
```javascript
const data = [
{x: 0, y: 0},
{x: 10, y: 5},
{x: 20, y: 0}
];
const line = fc.seriesSvgLine()
.crossValue(d => d.x)
.mainValue(d => d.y)
.xScale(xScale)
.yScale(yScale);
d3.select('g')
.datum(data)
.call(line);
```
The line component is configured with the required value accessors and scales. In this case, the supplied data has `x` and `y` properties. The value accessors are invoked on each datum within the array, and simply obtain the value for their respective property. The scales are used to convert the values in the domain coordinate system (as returned by the accessors), to the screen coordinate system.
The series is rendered into a group (`g`) element by first selecting it, using `datum` to associate the data with this DOM node, then using `call` to invoke the series component, causing it to be rendered.
#### Canvas rendering
The `seriesCanvasLine` component has an API that is almost identical to its SVG counterpart, `seriesSvgLine`, the only difference is the addition of a `context` property, which is set to the context of the canvas that this series renders to.
```javascript
const data = [
{x: 0, y: 0},
{x: 10, y: 5},
{x: 20, y: 0}
];
var ctx = canvas.getContext('2d');
const line = fc.seriesCanvasLine()
.crossValue(d => d.x)
.mainValue(d => d.y)
.xScale(xScale)
.yScale(yScale)
.context(ctx);
line(data);
```
Because D3 data-joins and data-binding only work on HTML / SVG, the canvas components are invoked directly with the supplied data. This causes the component to render itself to the canvas.
#### WebGL rendering
*If this is your first time using WebGL, this collection of higher-level series components is the best place to start. Only investigate the low-level components in [d3fc-webgl](https://github.com/d3fc/d3fc/tree/master/packages/d3fc-webgl#d3fc-webgl) if you need bespoke functionality.*
***WebGL rendering does not yet have full feature parity with the other rendering methods. Please check the API documentation against the methods to see what is currently supported.***
The `seriesWebglLine` component has an API that is almost identical to its canvas counterpart, `seriesCanvasLine`. The only difference is the `context` property, which requires a `contextType` of `'webgl'`.
```javascript
const data = [
{x: 0, y: 0},
{x: 10, y: 5},
{x: 20, y: 0}
];
var ctx = canvas.getContext('webgl');
const line = fc.seriesWebglLine()
.crossValue(d => d.x)
.mainValue(d => d.y)
.xScale(xScale)
.yScale(yScale)
.context(ctx);
line(data);
```
As with the canvas, the components are invoked directly with the supplied data. However, as with the transition from SVG to canvas, WebGL has its own subtle differences.
WebGL is based upon a pipeline of processing the data into the an appropriate format for the GPU, loading this data into the GPU and then allowing the GPU to process the data in a highly parallel fashion. When using these components, the bottlenecks in this pipeline are most commonly the pre-processing of data and the loading of data into the GPU, both of which are performed or controlled by JavaScript.
Some of this performance optimisation is addressed by the design of the components (e.g. how we pre-process the data and in to what form) and some of it necessitates the optimal use of the components by consumers (e.g. when we need to pre-process/load the data). In all cases consumers should be aiming to reduce the amount of pre-processing and loading of data to achieve the best performance.
The components offer two WebGL-specific methods to allow finer control over these processses -
* `equals` - This property is an equality function to control whether any pre-processing of the data is required i.e. is the data being rendered equal to the rendered on the previous call. If the data is considered equal, then the value accessors will not be invoked and the data previously loaded into the GPU will be re-used. The only exception to this is if one of the scales has a JavaScript pre-processing requirement, see the next bullet.
* `scaleMapper` - This property is a mapping function which controls whether the scales require JavaScript pre-processing or are pure GPU implementations. If a scale has a pure GPU implemention, then the data previously loaded into the GPU will be re-used and no JavaScript processing will be required. If not, the value accessor for the scaled value as well as the scaling function itself will be invoked for each data point, the resulting data will then be transferred to the GPU before rendering.
Where datasets are static, the above properties will be sufficient to achieve the best performance. Where datasets are dynamic, splitting the datasets into separate dynamic/static datasets and rendering each as a separate series (following the above advice) will achieve the best performance. If this is not possible then dropping down to lower-level [d3fc-webgl](https://github.com/d3fc/d3fc/tree/master/packages/d3fc-webgl#d3fc-webgl) components may be required to achieve the best performance. However, this requires a considered approach and should only be attempted if the above advice can't be followed.
#### Decorate Pattern
The series components implement the decorate pattern by exposing a `decorate` property which is passed the data join selection, canvas context or program builder, used to render the component. This allows users of the component to perform additional rendering logic.
For further details, consult the [Decorate Pattern documentation](https://d3fc.io/introduction/decorate-pattern.html).
The following example demonstrates how the fill color of each bar can be varied via decoration. The decorate property is passed the data join selection used to construct the component's DOM. Here, the enter selection is used to set the fill color based on the index:
```javascript
const color = d3.scaleOrdinal(d3.schemeCategory10);
const svgBar = fc.seriesSvgBar()
.decorate((selection) => {
selection.enter()
.style('fill', (_, i) => color(i));
});
```
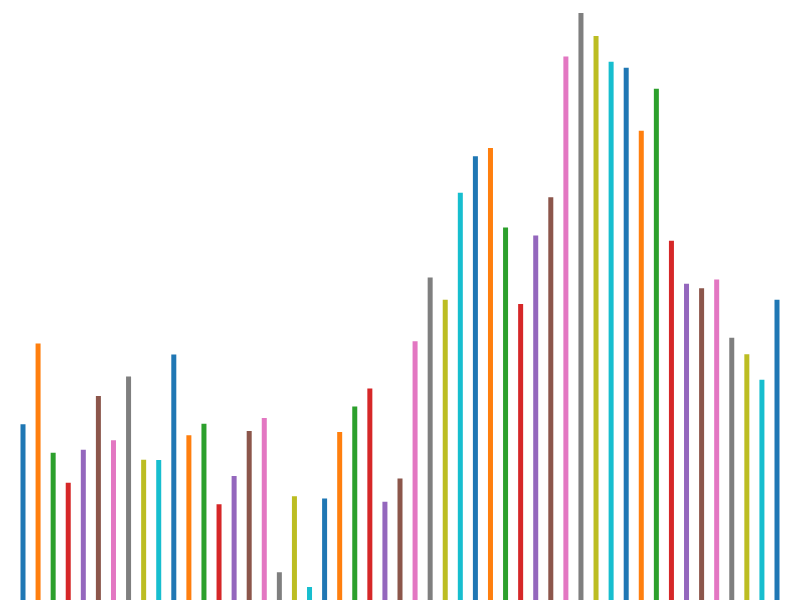 Here is the same example for a canvas bar series; the way that the decorate pattern works is subtly different. For SVG components the decorate function is invoked once with the selection that renders all of the bars (or points, candlesticks, ...), with canvas, the decorate function is invoked for each of the data-points in the series.
The decorate function is passed the context, datum and index. The context is translated to the correct position and the fill color set before invoking the decorate function. After decoration the bar itself is rendered.
```javascript
const canvasLine = fc.seriesCanvasBar()
.decorate((context, datum, index) => {
context.fillStyle = color(index);
});
```
Here is the same example for a canvas bar series; the way that the decorate pattern works is subtly different. For SVG components the decorate function is invoked once with the selection that renders all of the bars (or points, candlesticks, ...), with canvas, the decorate function is invoked for each of the data-points in the series.
The decorate function is passed the context, datum and index. The context is translated to the correct position and the fill color set before invoking the decorate function. After decoration the bar itself is rendered.
```javascript
const canvasLine = fc.seriesCanvasBar()
.decorate((context, datum, index) => {
context.fillStyle = color(index);
});
```
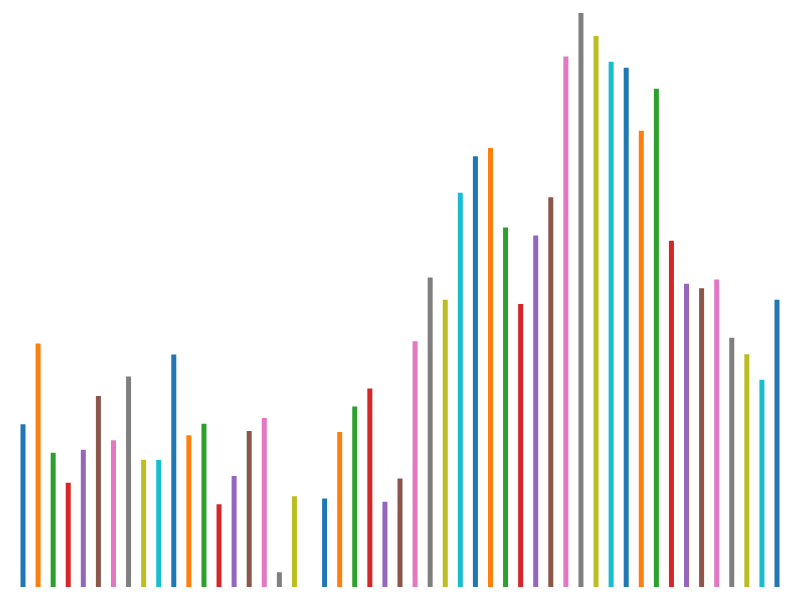 And here is the same example for a WebGL series; again the pattern is subtly different. In WebGL the fill color needs to be passed down to the GPU using an attribute and then applied by a shader to the rendered bar. This is all wrapped up by the `webglFillColor` component.
```javascript
const webglBar = fc.seriesWebglBar()
.decorate((program, data) => {
fc.webglFillColor()
.value((_, i) => {
const rgba = d3.color(color(i));
return [rgba.r / 255, rgba.g / 255, rgba.b / 255, rgba.opacity];
})
.data(data)(program);
});
webglBar(data);
```
Decoration can also be used to add extra elements to the series. In this example a text element is added to each bar via the enter selection.
The origin of each data-point container, which is a `g` element, is always set to the data-point location. As a result, the text element is translated vertically by `-10`, in order to position them just above each bar.
```javascript
const svgBar = fc.seriesSvgBar()
.decorate((selection) => {
selection.enter()
.append('text')
.style('text-anchor', 'middle')
.attr('transform', 'translate(0, -10)')
.attr('fill', 'black')
.text((d) => d3.format('.2f')(d));
});
```
And here is the same example for a WebGL series; again the pattern is subtly different. In WebGL the fill color needs to be passed down to the GPU using an attribute and then applied by a shader to the rendered bar. This is all wrapped up by the `webglFillColor` component.
```javascript
const webglBar = fc.seriesWebglBar()
.decorate((program, data) => {
fc.webglFillColor()
.value((_, i) => {
const rgba = d3.color(color(i));
return [rgba.r / 255, rgba.g / 255, rgba.b / 255, rgba.opacity];
})
.data(data)(program);
});
webglBar(data);
```
Decoration can also be used to add extra elements to the series. In this example a text element is added to each bar via the enter selection.
The origin of each data-point container, which is a `g` element, is always set to the data-point location. As a result, the text element is translated vertically by `-10`, in order to position them just above each bar.
```javascript
const svgBar = fc.seriesSvgBar()
.decorate((selection) => {
selection.enter()
.append('text')
.style('text-anchor', 'middle')
.attr('transform', 'translate(0, -10)')
.attr('fill', 'black')
.text((d) => d3.format('.2f')(d));
});
```
 With canvas, you can also perform additional rendering to the canvas in order to achieve the same effect. Once again, the canvas origin has been translated to the origin of each data-point before the decorate function is invoked.
This example uses a point series, for a bit of variety!
```javascript
const canvasLine = fc.seriesCanvasPoint()
.decorate((context, datum, index) => {
context.textAlign = 'center';
context.fillStyle = '#000';
context.font = '15px Arial';
context.fillText(d3.format('.2f')(datum), 0, -10);
// reset the fill style for the bar rendering
context.fillStyle = '#999';
});
```
With canvas, you can also perform additional rendering to the canvas in order to achieve the same effect. Once again, the canvas origin has been translated to the origin of each data-point before the decorate function is invoked.
This example uses a point series, for a bit of variety!
```javascript
const canvasLine = fc.seriesCanvasPoint()
.decorate((context, datum, index) => {
context.textAlign = 'center';
context.fillStyle = '#000';
context.font = '15px Arial';
context.fillText(d3.format('.2f')(datum), 0, -10);
// reset the fill style for the bar rendering
context.fillStyle = '#999';
});
```
 Whilst it is possible to do something similar with WebGL, it would be a much more involved process involving heavy customisation of the shaders. In most cases it would be easier to render the bulk of the data as a WebGL base series and then overlay a subset of the data using a decorated SVG/canvas series.
#### Orientation
Most of the series renderers support both horizontal and vertical render orientations as specified by the `orient` property. In order to make it easy to change the orientation of a series, and to avoid redundant and repeated property names, a change in orientation is achieved by transposing the x and y scales.
The following example shows a simple bar series rendered in its default vertical orientation:
```javascript
const data = [4, 6, 8, 6, 0, 10];
const xScale = d3.scaleLinear()
.domain([0, data.length])
.range([0, width]);
const yScale = d3.scaleLinear()
.domain([0, 10])
.range([height, 0]);
const barSeries = fc.seriesSvgBar()
.xScale(xScale)
.yScale(yScale)
.crossValue((_, i) => i)
.mainValue((d) => d);
d3.select('g')
.datum(data)
.call(svgBar);
```
By setting its `orient` property to `horizontal`, the x and y scales are transposed. As a result, the domain for both the x and y scale have to be switched. The following shows the changes required:
```javascript
const xScale = d3.scaleLinear()
.domain([0, 10]) // domain changed
.range([0, width]);
const yScale = d3.scaleLinear()
.domain([0, data.length]) // domain changed
.range([height, 0]);
const barSeries = fc.seriesSvgBar()
.xScale(xScale)
.yScale(yScale)
.orient('horizontal') // orient property updated
.crossValue((_, i) => i)
.mainValue((d) => d);
```
This is part of the motivation behind naming the accessors `mainValue` and `crossValue`, rather than an orientation specific `xValue` / `yValue`.
#### Multi series
One series type that is worthy of note is the multi series. This component provides a convenient way to render multiple series, that share scales, to the same SVG or canvas.
The multi series renderers expose a `series` property which accepts an array of series renderers, together with the standard `xScale` and `yScale` properties. The following example shows how a multi series can be used to render both a line and bar series:
```javascript
// a couple of series - value accessor configuration omitted for clarity
const barSeries = fc.seriesSvgBar();
const lineSeries = fc.seriesSvgLine();
const multiSeries = fc.seriesSvgMulti()
.xScale(xScale)
.yScale(yScale)
.series([barSeries, lineSeries]);
d3.select('g')
.datum(data)
.call(svgMulti);
```
Notice that you do not have to set the `xScale` and `yScale` properties on each series - the scales are propagated down from the multi series.
The canvas API is very similar:
```javascript
// a couple of series - value accessor configuration omitted for clarity
const barSeries = fc.seriesCanvasBar();
const lineSeries = fc.seriesCanvasLine();
const multiSeries = fc.seriesCanvasMulti()
.xScale(xScale)
.yScale(yScale)
.context(ctx)
.series([barSeries, lineSeries]);
multiSeries(data)
```
In this case the context is also propagated from the multi series to the children.
The multi series allows you to combine a range of different series types. If instead you have multiple data series that you want to render using the same series type, e.g. a chart containing multiple lines, the [repeat series](#repeat) is an easier way to achieve this.
#### Auto bandwidth
A number of the series (bar, OHLC, boxplot) have a notion of 'width'. They all expose a `bandwidth` property where you can supply the width as a value (in the screen coordinate system).
Rather than specify a bandwidth directly, you can adapt a series with the `fc.autoBandwidth` component, which will either obtain the bandwidth directly from the scale, or compute it based on the distribution of data.
When used with a `bandScale`, the scale is responsible for computing the width of each band. The `fc.autoBandwidth` component invokes the `bandwidth` function on the scale and uses the returned value to set the `bandwidth` on the series.
```javascript
var xScale = d3.scaleBand()
.domain(data.map(d => d.x))
.rangeRound([0, width]);
var svgBar = fc.autoBandwidth(fc.seriesSvgBar())
.align('left')
.crossValue(function(d) { return d.x; })
.mainValue(function(d) { return d.y; });
```
Notice in the above example that the `align` property of the bar is set to `left`, which reflects the band scale coordinate system.
**NOTE:** The D3 point scale is a special cased band scale that has a zero bandwidth. As a result, if you use the `fc.autoBandwidth` component in conjunction with a point scale, the series will also have a bandwidth of zero!
When used in conjunction with a linear scale, the `fc.autoBandwidth` component computes the bar width based on the smallest distance between consecutive datapoints:
```javascript
var xScale = d3.scaleLinear()
.domain([0, 10])
.range([0, width]);
var svgBar = fc.autoBandwidth(fc.seriesSvgBar())
.crossValue(function(d) { return d.x; })
.mainValue(function(d) { return d.y; })
.widthFraction(0.5);
```
The `fc.autoBandwidth` component, when adapting a series, adds a `widthFraction` property which determines the fraction of this distance that is used to set the bandwidth.
When using a multi, or repeat series, the `fc.autoBandwidth` component should be used to adapt the bar (or OHLC, boxplot, ...) series directly, rather than adapting the multi or repeat series.
```javascript
var canvasBar = fc.seriesCanvasBar()
var canvasLine = fc.seriesCanvasLine();
var canvasMulti = fc.seriesCanvasMulti()
.xScale(xScale)
.yScale(yScale)
.series([fc.autoBandwidth(canvasBar), canvasLine]);
```
#### Accessors
All of the series expose `xValues`/`yValues` methods which return an array of all of the accessors used by the series when retrieving values for use with the `xScale`/`yScale` respectively.
### Line
Whilst it is possible to do something similar with WebGL, it would be a much more involved process involving heavy customisation of the shaders. In most cases it would be easier to render the bulk of the data as a WebGL base series and then overlay a subset of the data using a decorated SVG/canvas series.
#### Orientation
Most of the series renderers support both horizontal and vertical render orientations as specified by the `orient` property. In order to make it easy to change the orientation of a series, and to avoid redundant and repeated property names, a change in orientation is achieved by transposing the x and y scales.
The following example shows a simple bar series rendered in its default vertical orientation:
```javascript
const data = [4, 6, 8, 6, 0, 10];
const xScale = d3.scaleLinear()
.domain([0, data.length])
.range([0, width]);
const yScale = d3.scaleLinear()
.domain([0, 10])
.range([height, 0]);
const barSeries = fc.seriesSvgBar()
.xScale(xScale)
.yScale(yScale)
.crossValue((_, i) => i)
.mainValue((d) => d);
d3.select('g')
.datum(data)
.call(svgBar);
```
By setting its `orient` property to `horizontal`, the x and y scales are transposed. As a result, the domain for both the x and y scale have to be switched. The following shows the changes required:
```javascript
const xScale = d3.scaleLinear()
.domain([0, 10]) // domain changed
.range([0, width]);
const yScale = d3.scaleLinear()
.domain([0, data.length]) // domain changed
.range([height, 0]);
const barSeries = fc.seriesSvgBar()
.xScale(xScale)
.yScale(yScale)
.orient('horizontal') // orient property updated
.crossValue((_, i) => i)
.mainValue((d) => d);
```
This is part of the motivation behind naming the accessors `mainValue` and `crossValue`, rather than an orientation specific `xValue` / `yValue`.
#### Multi series
One series type that is worthy of note is the multi series. This component provides a convenient way to render multiple series, that share scales, to the same SVG or canvas.
The multi series renderers expose a `series` property which accepts an array of series renderers, together with the standard `xScale` and `yScale` properties. The following example shows how a multi series can be used to render both a line and bar series:
```javascript
// a couple of series - value accessor configuration omitted for clarity
const barSeries = fc.seriesSvgBar();
const lineSeries = fc.seriesSvgLine();
const multiSeries = fc.seriesSvgMulti()
.xScale(xScale)
.yScale(yScale)
.series([barSeries, lineSeries]);
d3.select('g')
.datum(data)
.call(svgMulti);
```
Notice that you do not have to set the `xScale` and `yScale` properties on each series - the scales are propagated down from the multi series.
The canvas API is very similar:
```javascript
// a couple of series - value accessor configuration omitted for clarity
const barSeries = fc.seriesCanvasBar();
const lineSeries = fc.seriesCanvasLine();
const multiSeries = fc.seriesCanvasMulti()
.xScale(xScale)
.yScale(yScale)
.context(ctx)
.series([barSeries, lineSeries]);
multiSeries(data)
```
In this case the context is also propagated from the multi series to the children.
The multi series allows you to combine a range of different series types. If instead you have multiple data series that you want to render using the same series type, e.g. a chart containing multiple lines, the [repeat series](#repeat) is an easier way to achieve this.
#### Auto bandwidth
A number of the series (bar, OHLC, boxplot) have a notion of 'width'. They all expose a `bandwidth` property where you can supply the width as a value (in the screen coordinate system).
Rather than specify a bandwidth directly, you can adapt a series with the `fc.autoBandwidth` component, which will either obtain the bandwidth directly from the scale, or compute it based on the distribution of data.
When used with a `bandScale`, the scale is responsible for computing the width of each band. The `fc.autoBandwidth` component invokes the `bandwidth` function on the scale and uses the returned value to set the `bandwidth` on the series.
```javascript
var xScale = d3.scaleBand()
.domain(data.map(d => d.x))
.rangeRound([0, width]);
var svgBar = fc.autoBandwidth(fc.seriesSvgBar())
.align('left')
.crossValue(function(d) { return d.x; })
.mainValue(function(d) { return d.y; });
```
Notice in the above example that the `align` property of the bar is set to `left`, which reflects the band scale coordinate system.
**NOTE:** The D3 point scale is a special cased band scale that has a zero bandwidth. As a result, if you use the `fc.autoBandwidth` component in conjunction with a point scale, the series will also have a bandwidth of zero!
When used in conjunction with a linear scale, the `fc.autoBandwidth` component computes the bar width based on the smallest distance between consecutive datapoints:
```javascript
var xScale = d3.scaleLinear()
.domain([0, 10])
.range([0, width]);
var svgBar = fc.autoBandwidth(fc.seriesSvgBar())
.crossValue(function(d) { return d.x; })
.mainValue(function(d) { return d.y; })
.widthFraction(0.5);
```
The `fc.autoBandwidth` component, when adapting a series, adds a `widthFraction` property which determines the fraction of this distance that is used to set the bandwidth.
When using a multi, or repeat series, the `fc.autoBandwidth` component should be used to adapt the bar (or OHLC, boxplot, ...) series directly, rather than adapting the multi or repeat series.
```javascript
var canvasBar = fc.seriesCanvasBar()
var canvasLine = fc.seriesCanvasLine();
var canvasMulti = fc.seriesCanvasMulti()
.xScale(xScale)
.yScale(yScale)
.series([fc.autoBandwidth(canvasBar), canvasLine]);
```
#### Accessors
All of the series expose `xValues`/`yValues` methods which return an array of all of the accessors used by the series when retrieving values for use with the `xScale`/`yScale` respectively.
### Line
 # fc.**seriesSvgLine**()
# fc.**seriesCanvasLine**()
# fc.**seriesWebglLine**()
Constructs a new line renderer for canvas, WebGL or SVG.
#### Common properties
# *seriesLine*.**crossValue**(*accessorFunc*)
# *seriesLine*.**mainValue**(*accessorFunc*)
If *accessorFunc* is specified, sets the accessor to the specified function and returns this series. If *accessorFunc* is not specified, returns the current accessor. The `accessorFunc(datum, index)` function is called on each item of the data, returning the relevant value for the given accessor. The respective scale is applied to the value returned by the accessor before rendering.
# *seriesLine*.**xScale**(*scale*)
# *seriesLine*.**yScale**(*scale*)
If *scale* is specified, sets the scale and returns this series. If *scale* is not specified, returns the current scale.
# *seriesLine*.**orient**(*orientation*)
If *orientation* is specified, sets the orientation and returns this series. If *orientation* is not specified, returns the current orientation. The orientation value should be either `horizontal` (default) or `vertical`.
# *seriesLine*.**curve**(*scale*)
The WebGL implementation does not support this property.
If *curve* is specified, sets the curve factory and returns this series. If *curve* is not specified, returns the current curve factory.
This property is rebound from [line.curve](https://github.com/d3/d3-shape#line_curve).
# *seriesLine*.**context**(*ctx*)
The SVG implementation does not support this property.
If *ctx* is specified, sets the canvas context and returns this series. If *ctx* is not specified, returns the current context.
# *seriesLine*.**lineWidth**(*width*)
The SVG and canvas implementations do not support this property.
If *width* is specified, sets the line width and returns this series. If *width* is not specified, returns the current line width.
# *seriesLine*.**equals**(*equals*)
The SVG and canvas implementations do not support this property.
If *equals* is specified, sets the equality function used to compare *previousData* with *data*. The result of this check is used to control whether the data is reprojected and rescaled. If *equals* is not specified, returns the current equality function which defaults to always returning false indicating the data has changed.
# *seriesLine*.**pixelRatio**(*pixelRatio*)
The SVG and canvas implementations do not support this property.
If *pixelRatio* is specified, sets the factor used to scale any pixel values. If *pixelRatio* is not specified returns the current value.
# *seriesLine*.**scaleMapper**(*scaleMapper*)
The SVG and canvas implementations do not support this property.
If *scaleMapper* is specified, sets the function used to map first the xScale and then the yScale onto matched pairs of JavaScript and WebGL implementations. If *equals* is not specified, returns the current scale mapper which defaults to [webglScaleMapper](https://github.com/d3fc/d3fc/tree/master/packages/d3fc-webgl#webglScaleMapper).
The returned JavaScript scale is equality checked using a reference comparison to determine whether the data needs to be rescaled. If the reference is the same as the previous render, the values associated with the scale are not rescaled.
### Point
# fc.**seriesSvgLine**()
# fc.**seriesCanvasLine**()
# fc.**seriesWebglLine**()
Constructs a new line renderer for canvas, WebGL or SVG.
#### Common properties
# *seriesLine*.**crossValue**(*accessorFunc*)
# *seriesLine*.**mainValue**(*accessorFunc*)
If *accessorFunc* is specified, sets the accessor to the specified function and returns this series. If *accessorFunc* is not specified, returns the current accessor. The `accessorFunc(datum, index)` function is called on each item of the data, returning the relevant value for the given accessor. The respective scale is applied to the value returned by the accessor before rendering.
# *seriesLine*.**xScale**(*scale*)
# *seriesLine*.**yScale**(*scale*)
If *scale* is specified, sets the scale and returns this series. If *scale* is not specified, returns the current scale.
# *seriesLine*.**orient**(*orientation*)
If *orientation* is specified, sets the orientation and returns this series. If *orientation* is not specified, returns the current orientation. The orientation value should be either `horizontal` (default) or `vertical`.
# *seriesLine*.**curve**(*scale*)
The WebGL implementation does not support this property.
If *curve* is specified, sets the curve factory and returns this series. If *curve* is not specified, returns the current curve factory.
This property is rebound from [line.curve](https://github.com/d3/d3-shape#line_curve).
# *seriesLine*.**context**(*ctx*)
The SVG implementation does not support this property.
If *ctx* is specified, sets the canvas context and returns this series. If *ctx* is not specified, returns the current context.
# *seriesLine*.**lineWidth**(*width*)
The SVG and canvas implementations do not support this property.
If *width* is specified, sets the line width and returns this series. If *width* is not specified, returns the current line width.
# *seriesLine*.**equals**(*equals*)
The SVG and canvas implementations do not support this property.
If *equals* is specified, sets the equality function used to compare *previousData* with *data*. The result of this check is used to control whether the data is reprojected and rescaled. If *equals* is not specified, returns the current equality function which defaults to always returning false indicating the data has changed.
# *seriesLine*.**pixelRatio**(*pixelRatio*)
The SVG and canvas implementations do not support this property.
If *pixelRatio* is specified, sets the factor used to scale any pixel values. If *pixelRatio* is not specified returns the current value.
# *seriesLine*.**scaleMapper**(*scaleMapper*)
The SVG and canvas implementations do not support this property.
If *scaleMapper* is specified, sets the function used to map first the xScale and then the yScale onto matched pairs of JavaScript and WebGL implementations. If *equals* is not specified, returns the current scale mapper which defaults to [webglScaleMapper](https://github.com/d3fc/d3fc/tree/master/packages/d3fc-webgl#webglScaleMapper).
The returned JavaScript scale is equality checked using a reference comparison to determine whether the data needs to be rescaled. If the reference is the same as the previous render, the values associated with the scale are not rescaled.
### Point
 # fc.**seriesSvgPoint**()
# fc.**seriesCanvasPoint**()
# fc.**seriesWebglPoint**()
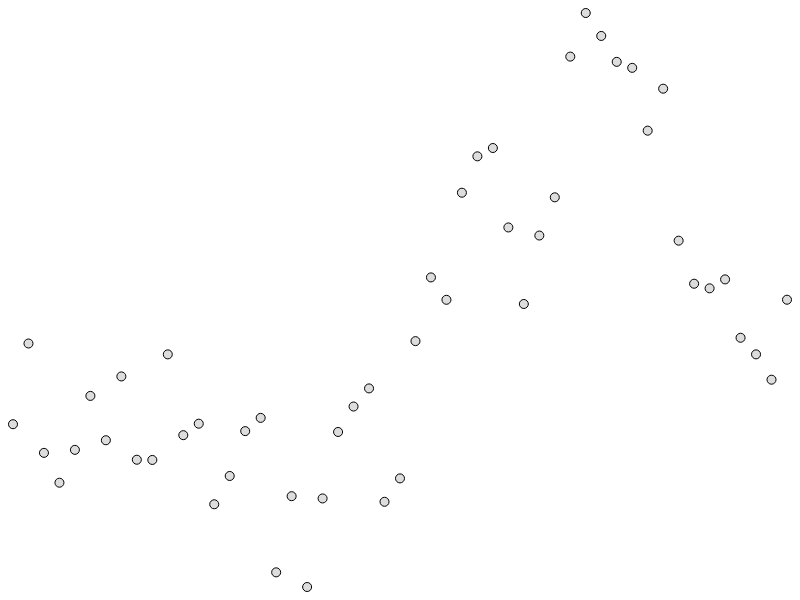
Constructs a new point series renderer for canvas, WebGL or SVG.
#### Common properties
# *seriesPoint*.**crossValue**(*accessorFunc*)
# *seriesPoint*.**mainValue**(*accessorFunc*)
If *accessorFunc* is specified, sets the accessor to the specified function and returns this series. If *accessorFunc* is not specified, returns the current accessor. The `accessorFunc(datum, index)` function is called on each item of the data, returning the relevant value for the given accessor. The respective scale is applied to the value returned by the accessor before rendering.
# *seriesPoint*.**xScale**(*scale*)
# *seriesPoint*.**yScale**(*scale*)
If *scale* is specified, sets the scale and returns this series. If *scale* is not specified, returns the current scale.
# *seriesPoint*.**orient**(*orientation*)
If *orientation* is specified, sets the orientation and returns this series. If *orientation* is not specified, returns the current orientation. The orientation value should be either `horizontal` (default) or `vertical`.
# *seriesPoint*.**type**(*type*)
The WebGL implementation does not support the following shapes: diamond, star, wye.
If *type* is specified, sets the symbol type to the specified function or symbol type and returns this point series renderer. If *type* is not specified, returns the current symbol type accessor.
This property is rebound from [symbol.type](https://github.com/d3/d3-shape#symbol_type).
# *seriesPoint*.**size**(*size*)
If *size* is specified, sets the area to the specified function or number and returns this point series renderer. If *size* is not specified, returns the current size accessor.
This property is rebound from [symbol.size](https://github.com/d3/d3-shape#symbol_size).
# *seriesPoint*.**context**(*ctx*)
The SVG implementation does not support this property.
If *ctx* is specified, sets the canvas context and returns this series. If *ctx* is not specified, returns the current context.
# *seriesPoint*.**equals**(*equals*)
The SVG and canvas implementations do not support this property.
If *equals* is specified, sets the equality function used to compare *previousData* with *data*. The result of this check is used to control whether the data is reprojected and rescaled. If *equals* is not specified, returns the current equality function which defaults to always returning false indicating the data has changed.
# *seriesPoin*.**pixelRatio**(*pixelRatio*)
The SVG and canvas implementations do not support this property.
If *pixelRatio* is specified, sets the factor used to scale any pixel values. If *pixelRatio* is not specified returns the current value.
# *seriesPoint*.**scaleMapper**(*scaleMapper*)
The SVG and canvas implementations do not support this property.
If *scaleMapper* is specified, sets the function used to map first the xScale and then the yScale onto matched pairs of JavaScript and WebGL implementations. If *equals* is not specified, returns the current scale mapper which defaults to [webglScaleMapper](https://github.com/d3fc/d3fc/tree/master/packages/d3fc-webgl#webglScaleMapper).
The returned JavaScript scale is equality checked using a reference comparison to determine whether the data needs to be rescaled. If the reference is the same as the previous render, the values associated with the scale are not rescaled.
### Area
# fc.**seriesSvgPoint**()
# fc.**seriesCanvasPoint**()
# fc.**seriesWebglPoint**()
Constructs a new point series renderer for canvas, WebGL or SVG.
#### Common properties
# *seriesPoint*.**crossValue**(*accessorFunc*)
# *seriesPoint*.**mainValue**(*accessorFunc*)
If *accessorFunc* is specified, sets the accessor to the specified function and returns this series. If *accessorFunc* is not specified, returns the current accessor. The `accessorFunc(datum, index)` function is called on each item of the data, returning the relevant value for the given accessor. The respective scale is applied to the value returned by the accessor before rendering.
# *seriesPoint*.**xScale**(*scale*)
# *seriesPoint*.**yScale**(*scale*)
If *scale* is specified, sets the scale and returns this series. If *scale* is not specified, returns the current scale.
# *seriesPoint*.**orient**(*orientation*)
If *orientation* is specified, sets the orientation and returns this series. If *orientation* is not specified, returns the current orientation. The orientation value should be either `horizontal` (default) or `vertical`.
# *seriesPoint*.**type**(*type*)
The WebGL implementation does not support the following shapes: diamond, star, wye.
If *type* is specified, sets the symbol type to the specified function or symbol type and returns this point series renderer. If *type* is not specified, returns the current symbol type accessor.
This property is rebound from [symbol.type](https://github.com/d3/d3-shape#symbol_type).
# *seriesPoint*.**size**(*size*)
If *size* is specified, sets the area to the specified function or number and returns this point series renderer. If *size* is not specified, returns the current size accessor.
This property is rebound from [symbol.size](https://github.com/d3/d3-shape#symbol_size).
# *seriesPoint*.**context**(*ctx*)
The SVG implementation does not support this property.
If *ctx* is specified, sets the canvas context and returns this series. If *ctx* is not specified, returns the current context.
# *seriesPoint*.**equals**(*equals*)
The SVG and canvas implementations do not support this property.
If *equals* is specified, sets the equality function used to compare *previousData* with *data*. The result of this check is used to control whether the data is reprojected and rescaled. If *equals* is not specified, returns the current equality function which defaults to always returning false indicating the data has changed.
# *seriesPoin*.**pixelRatio**(*pixelRatio*)
The SVG and canvas implementations do not support this property.
If *pixelRatio* is specified, sets the factor used to scale any pixel values. If *pixelRatio* is not specified returns the current value.
# *seriesPoint*.**scaleMapper**(*scaleMapper*)
The SVG and canvas implementations do not support this property.
If *scaleMapper* is specified, sets the function used to map first the xScale and then the yScale onto matched pairs of JavaScript and WebGL implementations. If *equals* is not specified, returns the current scale mapper which defaults to [webglScaleMapper](https://github.com/d3fc/d3fc/tree/master/packages/d3fc-webgl#webglScaleMapper).
The returned JavaScript scale is equality checked using a reference comparison to determine whether the data needs to be rescaled. If the reference is the same as the previous render, the values associated with the scale are not rescaled.
### Area
 # fc.**seriesSvgArea**()
# fc.**seriesCanvasArea**()
# fc.**seriesWebglArea**()
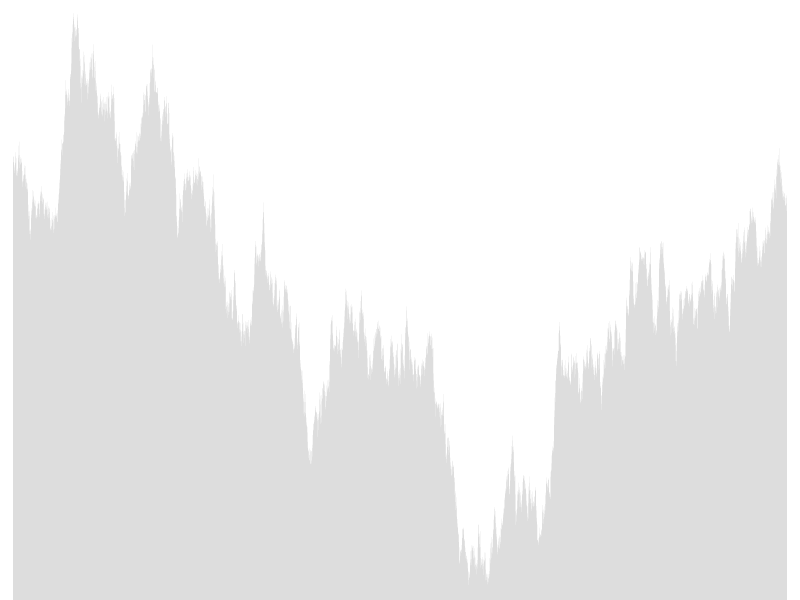
Constructs a new area series renderer for canvas, WebGL or SVG.
#### Common properties
# *seriesArea*.**crossValue**(*accessorFunc*)
# *seriesArea*.**mainValue**(*accessorFunc*)
# *seriesArea*.**baseValue**(*accessorFunc*)
If *accessorFunc* is specified, sets the accessor to the specified function and returns this series. If *accessorFunc* is not specified, returns the current accessor. The `accessorFunc(datum, index)` function is called on each item of the data, returning the relevant value for the given accessor. The respective scale is applied to the value returned by the accessor before rendering.
# *seriesArea*.**orient**(*orientation*)
The WebGL implementation does not support this property.
If *orientation* is specified, sets the orientation and returns this series. If *orientation* is not specified, returns the current orientation. The orientation value should be either `horizontal` (default) or `vertical`.
# *seriesArea*.**xScale**(*scale*)
# *seriesArea*.**yScale**(*scale*)
If *scale* is specified, sets the scale and returns this series. If *scale* is not specified, returns the current scale.
# *seriesArea*.**curve**(*scale*)
The WebGL implementation does not support this property.
If *curve* is specified, sets the curve factory and returns this series. If *curve* is not specified, returns the current curve factory.
# *seriesArea*.**context**(*ctx*)
The SVG implementation does not support this property.
If *ctx* is specified, sets the canvas context and returns this series. If *ctx* is not specified, returns the current context.
# *seriesArea*.**equals**(*equals*)
The SVG and canvas implementations do not support this property.
If *equals* is specified, sets the equality function used to compare *previousData* with *data*. The result of this check is used to control whether the data is reprojected and rescaled. If *equals* is not specified, returns the current equality function which defaults to always returning false indicating the data has changed.
# *seriesArea*.**pixelRatio**(*pixelRatio*)
The SVG and canvas implementations do not support this property.
If *pixelRatio* is specified, sets the factor used to scale any pixel values. If *pixelRatio* is not specified returns the current value.
# *seriesArea*.**scaleMapper**(*scaleMapper*)
The SVG and canvas implementations do not support this property.
If *scaleMapper* is specified, sets the function used to map first the xScale and then the yScale onto matched pairs of JavaScript and WebGL implementations. If *equals* is not specified, returns the current scale mapper which defaults to [webglScaleMapper](https://github.com/d3fc/d3fc/tree/master/packages/d3fc-webgl#webglScaleMapper).
The returned JavaScript scale is equality checked using a reference comparison to determine whether the data needs to be rescaled. If the reference is the same as the previous render, the values associated with the scale are not rescaled.
### Bar
# fc.**seriesSvgArea**()
# fc.**seriesCanvasArea**()
# fc.**seriesWebglArea**()
Constructs a new area series renderer for canvas, WebGL or SVG.
#### Common properties
# *seriesArea*.**crossValue**(*accessorFunc*)
# *seriesArea*.**mainValue**(*accessorFunc*)
# *seriesArea*.**baseValue**(*accessorFunc*)
If *accessorFunc* is specified, sets the accessor to the specified function and returns this series. If *accessorFunc* is not specified, returns the current accessor. The `accessorFunc(datum, index)` function is called on each item of the data, returning the relevant value for the given accessor. The respective scale is applied to the value returned by the accessor before rendering.
# *seriesArea*.**orient**(*orientation*)
The WebGL implementation does not support this property.
If *orientation* is specified, sets the orientation and returns this series. If *orientation* is not specified, returns the current orientation. The orientation value should be either `horizontal` (default) or `vertical`.
# *seriesArea*.**xScale**(*scale*)
# *seriesArea*.**yScale**(*scale*)
If *scale* is specified, sets the scale and returns this series. If *scale* is not specified, returns the current scale.
# *seriesArea*.**curve**(*scale*)
The WebGL implementation does not support this property.
If *curve* is specified, sets the curve factory and returns this series. If *curve* is not specified, returns the current curve factory.
# *seriesArea*.**context**(*ctx*)
The SVG implementation does not support this property.
If *ctx* is specified, sets the canvas context and returns this series. If *ctx* is not specified, returns the current context.
# *seriesArea*.**equals**(*equals*)
The SVG and canvas implementations do not support this property.
If *equals* is specified, sets the equality function used to compare *previousData* with *data*. The result of this check is used to control whether the data is reprojected and rescaled. If *equals* is not specified, returns the current equality function which defaults to always returning false indicating the data has changed.
# *seriesArea*.**pixelRatio**(*pixelRatio*)
The SVG and canvas implementations do not support this property.
If *pixelRatio* is specified, sets the factor used to scale any pixel values. If *pixelRatio* is not specified returns the current value.
# *seriesArea*.**scaleMapper**(*scaleMapper*)
The SVG and canvas implementations do not support this property.
If *scaleMapper* is specified, sets the function used to map first the xScale and then the yScale onto matched pairs of JavaScript and WebGL implementations. If *equals* is not specified, returns the current scale mapper which defaults to [webglScaleMapper](https://github.com/d3fc/d3fc/tree/master/packages/d3fc-webgl#webglScaleMapper).
The returned JavaScript scale is equality checked using a reference comparison to determine whether the data needs to be rescaled. If the reference is the same as the previous render, the values associated with the scale are not rescaled.
### Bar
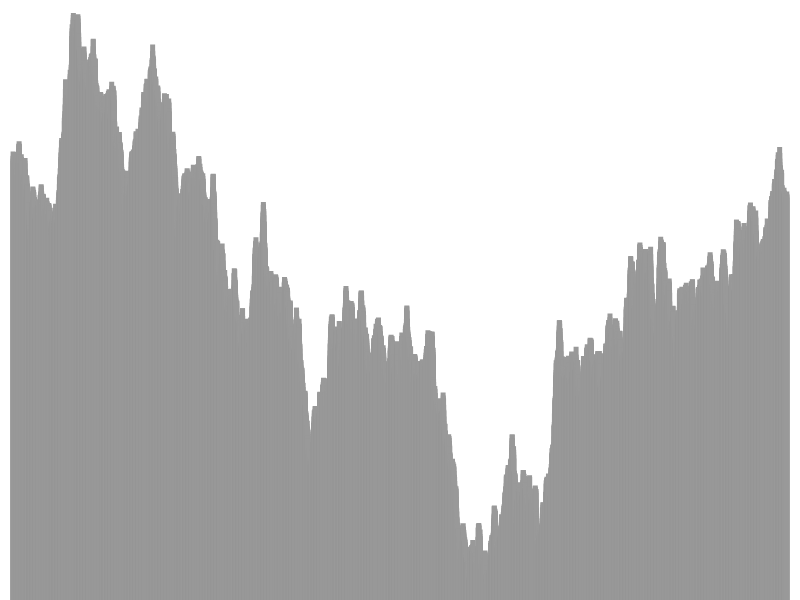 # fc.**seriesSvgBar**()
# fc.**seriesCanvasBar**()
# fc.**seriesWebglBar**()
Constructs a new bar series renderer for canvas, WebGL or SVG.
#### Common properties
# *seriesBar*.**crossValue**(*accessorFunc*)
# *seriesBar*.**mainValue**(*accessorFunc*)
# *seriesBar*.**baseValue**(*accessorFunc*)
If *accessorFunc* is specified, sets the accessor to the specified function and returns this series. If *accessorFunc* is not specified, returns the current accessor. The `accessorFunc(datum, index)` function is called on each item of the data, returning the relevant value for the given accessor. The respective scale is applied to the value returned by the accessor before rendering.
# *seriesBar*.**orient**(*orientation*)
The WebGL implementation does not support this property.
If *orientation* is specified, sets the orientation and returns this series. If *orientation* is not specified, returns the current orientation. The orientation value should be either `horizontal` (default) or `vertical`.
# *seriesBar*.**align**(*alignment*)
The WebGL implementation does not support this property.
If *alignment* is specified, sets the alignment and returns this series. If *alignment* is not specified, returns the current alignment. The alignment value should be `left`, `right` or `center` (default) and describes how the alignment of each bar with respect to the central value.
# *seriesBar*.**xScale**(*scale*)
# *seriesBar*.**yScale**(*scale*)
If *scale* is specified, sets the scale and returns this series. If *scale* is not specified, returns the current scale.
# *seriesBar*.**bandwidth**(*bandwidthFunc*)
If *bandwidthFunc* is specified, sets the bandwidth function and returns this series. If *bandwidthFunc* is not specified, returns the current bandwidth function.
# *seriesBar*.**context**(*ctx*)
The SVG implementation does not support this property.
If *ctx* is specified, sets the canvas context and returns this series. If *ctx* is not specified, returns the current context.
# *seriesBar*.**equals**(*equals*)
The SVG and canvas implementations do not support this property.
If *equals* is specified, sets the equality function used to compare *previousData* with *data*. The result of this check is used to control whether the data is reprojected and rescaled. If *equals* is not specified, returns the current equality function which defaults to always returning false indicating the data has changed.
# *seriesBar_*.**pixelRatio**(*pixelRatio*)
The SVG and canvas implementations do not support this property.
If *pixelRatio* is specified, sets the factor used to scale any pixel values. If *pixelRatio* is not specified returns the current value.
# *seriesBar*.**scaleMapper**(*scaleMapper*)
The SVG and canvas implementations do not support this property.
If *scaleMapper* is specified, sets the function used to map first the xScale and then the yScale onto matched pairs of JavaScript and WebGL implementations. If *equals* is not specified, returns the current scale mapper which defaults to [webglScaleMapper](https://github.com/d3fc/d3fc/tree/master/packages/d3fc-webgl#webglScaleMapper).
The returned JavaScript scale is equality checked using a reference comparison to determine whether the data needs to be rescaled. If the reference is the same as the previous render, the values associated with the scale are not rescaled.
### Candlestick
# fc.**seriesSvgBar**()
# fc.**seriesCanvasBar**()
# fc.**seriesWebglBar**()
Constructs a new bar series renderer for canvas, WebGL or SVG.
#### Common properties
# *seriesBar*.**crossValue**(*accessorFunc*)
# *seriesBar*.**mainValue**(*accessorFunc*)
# *seriesBar*.**baseValue**(*accessorFunc*)
If *accessorFunc* is specified, sets the accessor to the specified function and returns this series. If *accessorFunc* is not specified, returns the current accessor. The `accessorFunc(datum, index)` function is called on each item of the data, returning the relevant value for the given accessor. The respective scale is applied to the value returned by the accessor before rendering.
# *seriesBar*.**orient**(*orientation*)
The WebGL implementation does not support this property.
If *orientation* is specified, sets the orientation and returns this series. If *orientation* is not specified, returns the current orientation. The orientation value should be either `horizontal` (default) or `vertical`.
# *seriesBar*.**align**(*alignment*)
The WebGL implementation does not support this property.
If *alignment* is specified, sets the alignment and returns this series. If *alignment* is not specified, returns the current alignment. The alignment value should be `left`, `right` or `center` (default) and describes how the alignment of each bar with respect to the central value.
# *seriesBar*.**xScale**(*scale*)
# *seriesBar*.**yScale**(*scale*)
If *scale* is specified, sets the scale and returns this series. If *scale* is not specified, returns the current scale.
# *seriesBar*.**bandwidth**(*bandwidthFunc*)
If *bandwidthFunc* is specified, sets the bandwidth function and returns this series. If *bandwidthFunc* is not specified, returns the current bandwidth function.
# *seriesBar*.**context**(*ctx*)
The SVG implementation does not support this property.
If *ctx* is specified, sets the canvas context and returns this series. If *ctx* is not specified, returns the current context.
# *seriesBar*.**equals**(*equals*)
The SVG and canvas implementations do not support this property.
If *equals* is specified, sets the equality function used to compare *previousData* with *data*. The result of this check is used to control whether the data is reprojected and rescaled. If *equals* is not specified, returns the current equality function which defaults to always returning false indicating the data has changed.
# *seriesBar_*.**pixelRatio**(*pixelRatio*)
The SVG and canvas implementations do not support this property.
If *pixelRatio* is specified, sets the factor used to scale any pixel values. If *pixelRatio* is not specified returns the current value.
# *seriesBar*.**scaleMapper**(*scaleMapper*)
The SVG and canvas implementations do not support this property.
If *scaleMapper* is specified, sets the function used to map first the xScale and then the yScale onto matched pairs of JavaScript and WebGL implementations. If *equals* is not specified, returns the current scale mapper which defaults to [webglScaleMapper](https://github.com/d3fc/d3fc/tree/master/packages/d3fc-webgl#webglScaleMapper).
The returned JavaScript scale is equality checked using a reference comparison to determine whether the data needs to be rescaled. If the reference is the same as the previous render, the values associated with the scale are not rescaled.
### Candlestick
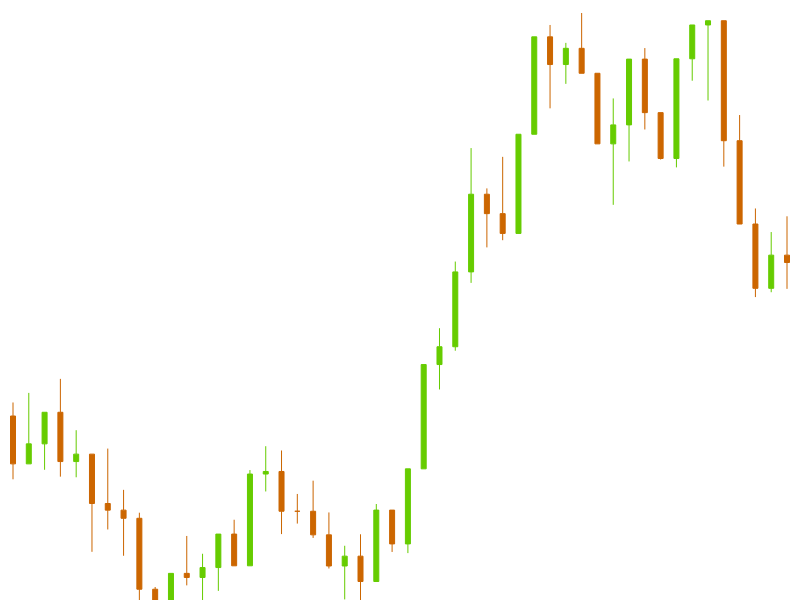 # fc.**seriesSvgCandlestick**()
# fc.**seriesCanvasCandlestick**()
# fc.**seriesWebglCandlestick**()
Constructs a new candlestick renderer for canvas, WebGL or SVG.
# *seriesCandlestick*.**crossValue**(*accessorFunc*)
# *seriesCandlestick*.**highValue**(*accessorFunc*)
# *seriesCandlestick*.**lowValue**(*accessorFunc*)
# *seriesCandlestick*.**openValue**(*accessorFunc*)
# *seriesCandlestick*.**closeValue**(*accessorFunc*)
If *accessorFunc* is specified, sets the accessor to the specified function and returns this series. If *accessorFunc* is not specified, returns the current accessor. The `accessorFunc(datum, index)` function is called on each item of the data, returning the relevant value for the given accessor. The respective scale is applied to the value returned by the accessor before rendering.
# *seriesCandlestick*.**xScale**(*scale*)
# *seriesCandlestick*.**yScale**(*scale*)
If *scale* is specified, sets the scale and returns this series. If *scale* is not specified, returns the current scale.
# *seriesCandlestick*.**bandwidth**(*bandwidthFunc*)
If *bandwidthFunc* is specified, sets the bandwidth function and returns this series. If *bandwidthFunc* is not specified, returns the current bandwidth function.
# *seriesCandlestick*.**align**(*alignment*)
The WebGL implementation does not support this property.
If *alignment* is specified, sets the alignment and returns this series. If *alignment* is not specified, returns the current alignment. The alignment value should be `left`, `right` or `center` (default) and describes how the alignment of each candlestick with respect to the central value.
# *seriesCandlestick*.**decorate**(*decorateFunc*)
If *decorateFunc* is specified, sets the decorator function to the specified function, and returns this series. If *decorateFunc* is not specified, returns the current decorator function.
# *seriesCandlestick*.**context**(*ctx*)
The SVG implementation does not support this property.
If *ctx* is specified, sets the canvas context and returns this series. If *ctx* is not specified, returns the current context.
# *seriesCandlestick*.**lineWidth**(*width*)
The SVG and canvas implementations do not support this property.
If *width* is specified, sets the line width and returns this series. If *width* is not specified, returns the current line width.
# *seriesCandlestick*.**equals**(*equals*)
The SVG and canvas implementations do not support this property.
If *equals* is specified, sets the equality function used to compare *previousData* with *data*. The result of this check is used to control whether the data is reprojected and rescaled. If *equals* is not specified, returns the current equality function which defaults to always returning false indicating the data has changed.
# *seriesCand*.**pixelRatio**(*pixelRatio*)
The SVG and canvas implementations do not support this property.
If *pixelRatio* is specified, sets the factor used to scale any pixel values. If *pixelRatio* is not specified returns the current value.
# *seriesCandlestick*.**scaleMapper**(*scaleMapper*)
The SVG and canvas implementations do not support this property.
If *scaleMapper* is specified, sets the function used to map first the xScale and then the yScale onto matched pairs of JavaScript and WebGL implementations. If *equals* is not specified, returns the current scale mapper which defaults to [webglScaleMapper](https://github.com/d3fc/d3fc/tree/master/packages/d3fc-webgl#webglScaleMapper).
The returned JavaScript scale is equality checked using a reference comparison to determine whether the data needs to be rescaled. If the reference is the same as the previous render, the values associated with the scale are not rescaled.
### OHLC
# fc.**seriesSvgCandlestick**()
# fc.**seriesCanvasCandlestick**()
# fc.**seriesWebglCandlestick**()
Constructs a new candlestick renderer for canvas, WebGL or SVG.
# *seriesCandlestick*.**crossValue**(*accessorFunc*)
# *seriesCandlestick*.**highValue**(*accessorFunc*)
# *seriesCandlestick*.**lowValue**(*accessorFunc*)
# *seriesCandlestick*.**openValue**(*accessorFunc*)
# *seriesCandlestick*.**closeValue**(*accessorFunc*)
If *accessorFunc* is specified, sets the accessor to the specified function and returns this series. If *accessorFunc* is not specified, returns the current accessor. The `accessorFunc(datum, index)` function is called on each item of the data, returning the relevant value for the given accessor. The respective scale is applied to the value returned by the accessor before rendering.
# *seriesCandlestick*.**xScale**(*scale*)
# *seriesCandlestick*.**yScale**(*scale*)
If *scale* is specified, sets the scale and returns this series. If *scale* is not specified, returns the current scale.
# *seriesCandlestick*.**bandwidth**(*bandwidthFunc*)
If *bandwidthFunc* is specified, sets the bandwidth function and returns this series. If *bandwidthFunc* is not specified, returns the current bandwidth function.
# *seriesCandlestick*.**align**(*alignment*)
The WebGL implementation does not support this property.
If *alignment* is specified, sets the alignment and returns this series. If *alignment* is not specified, returns the current alignment. The alignment value should be `left`, `right` or `center` (default) and describes how the alignment of each candlestick with respect to the central value.
# *seriesCandlestick*.**decorate**(*decorateFunc*)
If *decorateFunc* is specified, sets the decorator function to the specified function, and returns this series. If *decorateFunc* is not specified, returns the current decorator function.
# *seriesCandlestick*.**context**(*ctx*)
The SVG implementation does not support this property.
If *ctx* is specified, sets the canvas context and returns this series. If *ctx* is not specified, returns the current context.
# *seriesCandlestick*.**lineWidth**(*width*)
The SVG and canvas implementations do not support this property.
If *width* is specified, sets the line width and returns this series. If *width* is not specified, returns the current line width.
# *seriesCandlestick*.**equals**(*equals*)
The SVG and canvas implementations do not support this property.
If *equals* is specified, sets the equality function used to compare *previousData* with *data*. The result of this check is used to control whether the data is reprojected and rescaled. If *equals* is not specified, returns the current equality function which defaults to always returning false indicating the data has changed.
# *seriesCand*.**pixelRatio**(*pixelRatio*)
The SVG and canvas implementations do not support this property.
If *pixelRatio* is specified, sets the factor used to scale any pixel values. If *pixelRatio* is not specified returns the current value.
# *seriesCandlestick*.**scaleMapper**(*scaleMapper*)
The SVG and canvas implementations do not support this property.
If *scaleMapper* is specified, sets the function used to map first the xScale and then the yScale onto matched pairs of JavaScript and WebGL implementations. If *equals* is not specified, returns the current scale mapper which defaults to [webglScaleMapper](https://github.com/d3fc/d3fc/tree/master/packages/d3fc-webgl#webglScaleMapper).
The returned JavaScript scale is equality checked using a reference comparison to determine whether the data needs to be rescaled. If the reference is the same as the previous render, the values associated with the scale are not rescaled.
### OHLC
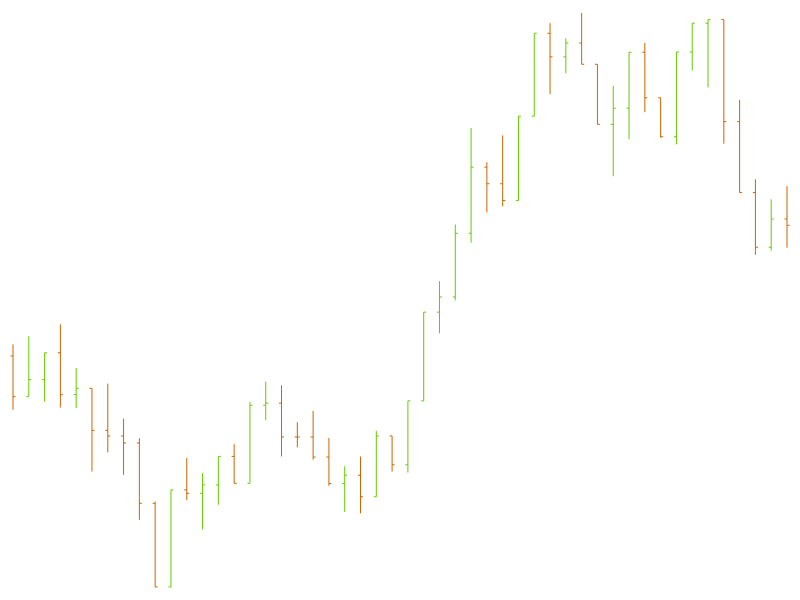 # fc.**seriesSvgOhlc**()
# fc.**seriesCanvasOhlc**()
# fc.**seriesWebglOhlc**()
Constructs a new OHLC renderer for canvas, WebGL or SVG.
#### Common properties
# *seriesOhlc*.**crossValue**(*accessorFunc*)
# *seriesOhlc*.**highValue**(*accessorFunc*)
# *seriesOhlc*.**lowValue**(*accessorFunc*)
# *seriesOhlc*.**openValue**(*accessorFunc*)
# *seriesOhlc*.**closeValue**(*accessorFunc*)
If *accessorFunc* is specified, sets the accessor to the specified function and returns this series. If *accessorFunc* is not specified, returns the current accessor. The `accessorFunc(datum, index)` function is called on each item of the data, returning the relevant value for the given accessor. The respective scale is applied to the value returned by the accessor before rendering.
# *seriesOhlc*.**xScale**(*scale*)
# *seriesOhlc*.**yScale**(*scale*)
If *scale* is specified, sets the scale and returns this series. If *scale* is not specified, returns the current scale.
# *seriesOhlc*.**bandwidth**(*bandwidthFunc*)
If *bandwidthFunc* is specified, sets the bandwidth function and returns this series. If *bandwidthFunc* is not specified, returns the current bandwidth function.
# *seriesOhlc*.**align**(*alignment*)
The WebGL implementation does not support this property.
If *alignment* is specified, sets the alignment and returns this series. If *alignment* is not specified, returns the current alignment. The alignment value should be `left`, `right` or `center` (default) and describes how the alignment of each OHLC with respect to the central value.
# *seriesOhlc*.**decorate**(*decorateFunc*)
If *decorateFunc* is specified, sets the decorator function to the specified function, and returns this series. If *decorateFunc* is not specified, returns the current decorator function.
# *seriesOhlc*.**context**(*ctx*)
The SVG implementation does not support this property.
If *ctx* is specified, sets the canvas context and returns this series. If *ctx* is not specified, returns the current context.
# *seriesOhlc*.**lineWidth**(*width*)
The SVG and canvas implementations do not support this property.
If *width* is specified, sets the line width and returns this series. If *width* is not specified, returns the current line width.
# *seriesOhlc*.**equals**(*equals*)
The SVG and canvas implementations do not support this property.
If *equals* is specified, sets the equality function used to compare *previousData* with *data*. The result of this check is used to control whether the data is reprojected and rescaled. If *equals* is not specified, returns the current equality function which defaults to always returning false indicating the data has changed.
# *seriesOhlc*.**pixelRatio**(*pixelRatio*)
The SVG and canvas implementations do not support this property.
If *pixelRatio* is specified, sets the factor used to scale any pixel values. If *pixelRatio* is not specified returns the current value.
# *seriesOhlc*.**scaleMapper**(*scaleMapper*)
The SVG and canvas implementations do not support this property.
If *scaleMapper* is specified, sets the function used to map first the xScale and then the yScale onto matched pairs of JavaScript and WebGL implementations. If *equals* is not specified, returns the current scale mapper which defaults to [webglScaleMapper](https://github.com/d3fc/d3fc/tree/master/packages/d3fc-webgl#webglScaleMapper).
The returned JavaScript scale is equality checked using a reference comparison to determine whether the data needs to be rescaled. If the reference is the same as the previous render, the values associated with the scale are not rescaled.
### Boxplot
# fc.**seriesSvgOhlc**()
# fc.**seriesCanvasOhlc**()
# fc.**seriesWebglOhlc**()
Constructs a new OHLC renderer for canvas, WebGL or SVG.
#### Common properties
# *seriesOhlc*.**crossValue**(*accessorFunc*)
# *seriesOhlc*.**highValue**(*accessorFunc*)
# *seriesOhlc*.**lowValue**(*accessorFunc*)
# *seriesOhlc*.**openValue**(*accessorFunc*)
# *seriesOhlc*.**closeValue**(*accessorFunc*)
If *accessorFunc* is specified, sets the accessor to the specified function and returns this series. If *accessorFunc* is not specified, returns the current accessor. The `accessorFunc(datum, index)` function is called on each item of the data, returning the relevant value for the given accessor. The respective scale is applied to the value returned by the accessor before rendering.
# *seriesOhlc*.**xScale**(*scale*)
# *seriesOhlc*.**yScale**(*scale*)
If *scale* is specified, sets the scale and returns this series. If *scale* is not specified, returns the current scale.
# *seriesOhlc*.**bandwidth**(*bandwidthFunc*)
If *bandwidthFunc* is specified, sets the bandwidth function and returns this series. If *bandwidthFunc* is not specified, returns the current bandwidth function.
# *seriesOhlc*.**align**(*alignment*)
The WebGL implementation does not support this property.
If *alignment* is specified, sets the alignment and returns this series. If *alignment* is not specified, returns the current alignment. The alignment value should be `left`, `right` or `center` (default) and describes how the alignment of each OHLC with respect to the central value.
# *seriesOhlc*.**decorate**(*decorateFunc*)
If *decorateFunc* is specified, sets the decorator function to the specified function, and returns this series. If *decorateFunc* is not specified, returns the current decorator function.
# *seriesOhlc*.**context**(*ctx*)
The SVG implementation does not support this property.
If *ctx* is specified, sets the canvas context and returns this series. If *ctx* is not specified, returns the current context.
# *seriesOhlc*.**lineWidth**(*width*)
The SVG and canvas implementations do not support this property.
If *width* is specified, sets the line width and returns this series. If *width* is not specified, returns the current line width.
# *seriesOhlc*.**equals**(*equals*)
The SVG and canvas implementations do not support this property.
If *equals* is specified, sets the equality function used to compare *previousData* with *data*. The result of this check is used to control whether the data is reprojected and rescaled. If *equals* is not specified, returns the current equality function which defaults to always returning false indicating the data has changed.
# *seriesOhlc*.**pixelRatio**(*pixelRatio*)
The SVG and canvas implementations do not support this property.
If *pixelRatio* is specified, sets the factor used to scale any pixel values. If *pixelRatio* is not specified returns the current value.
# *seriesOhlc*.**scaleMapper**(*scaleMapper*)
The SVG and canvas implementations do not support this property.
If *scaleMapper* is specified, sets the function used to map first the xScale and then the yScale onto matched pairs of JavaScript and WebGL implementations. If *equals* is not specified, returns the current scale mapper which defaults to [webglScaleMapper](https://github.com/d3fc/d3fc/tree/master/packages/d3fc-webgl#webglScaleMapper).
The returned JavaScript scale is equality checked using a reference comparison to determine whether the data needs to be rescaled. If the reference is the same as the previous render, the values associated with the scale are not rescaled.
### Boxplot
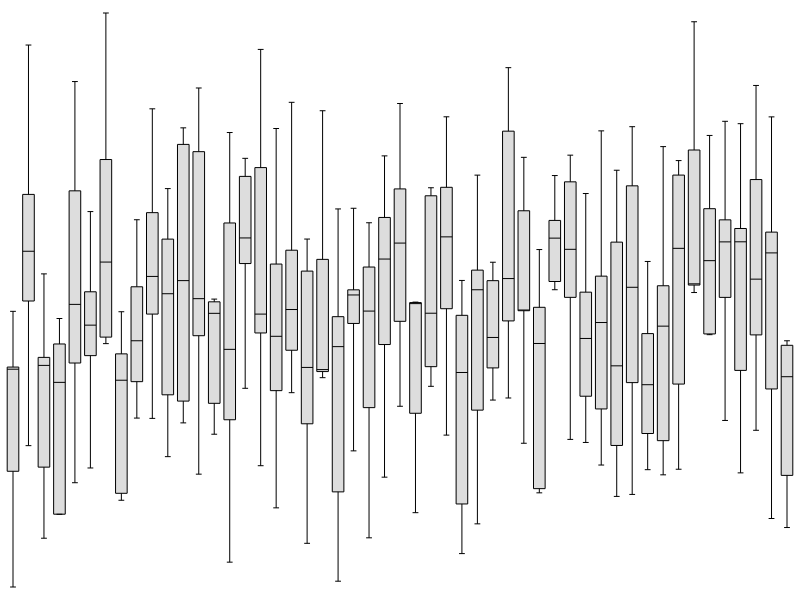 # fc.**seriesSvgBoxPlot**()
# fc.**seriesCanvasBoxPlot**()
# fc.**seriesWebglBoxPlot**()
Constructs a new boxplot renderer for canvas, WebGL or SVG.
#### Common properties
# *seriesBoxPlot*.**crossValue**(*accessorFunc*)
# *seriesBoxPlot*.**medianValue**(*accessorFunc*)
# *seriesBoxPlot*.**upperQuartileValue**(*accessorFunc*)
# *seriesBoxPlot*.**lowerQuartileValue**(*accessorFunc*)
# *seriesBoxPlot*.**highValue**(*accessorFunc*)
# *seriesBoxPlot*.**lowValue**(*accessorFunc*)
If *accessorFunc* is specified, sets the accessor to the specified function and returns this series. If *accessorFunc* is not specified, returns the current accessor. The `accessorFunc(datum, index)` function is called on each item of the data, returning the relevant value for the given accessor. The respective scale is applied to the value returned by the accessor before rendering.
# *seriesBoxPlot*.**orient**(*orientation*)
The WebGL implementation does not support this property.
If *orientation* is specified, sets the orientation and returns this series. If *orientation* is not specified, returns the current orientation. The orientation value should be either `horizontal` (default) or `vertical`
# *seriesBoxPlot*.**xScale**(*scale*)
# *seriesBoxPlot*.**yScale**(*scale*)
If *scale* is specified, sets the scale and returns this series. If *scale* is not specified, returns the current scale.
# *seriesBoxPlot*.**bandwidth**(*bandwidthFunc*)
If *bandwidthFunc* is specified, sets the bandwidth function and returns this series. If *bandwidthFunc* is not specified, returns the current bandwidth function.
# *seriesBoxPlot*.**align**(*alignment*)
The WebGL implementation does not support this property.
If *alignment* is specified, sets the alignment and returns this series. If *alignment* is not specified, returns the current alignment. The alignment value should be `left`, `right` or `center` (default) and describes how the alignment of each boxplot with respect to the central value.
# *seriesBoxPlot*.**cap**(*capFunc*)
If *capFunc* is specified, sets the cap function and returns this series. If *capFunc* is not specified, returns the current cap function. The `capFunc(item, index)` function is called on each item of the data, and returns the **proportion** of the box width that the caps width should be.
# *seriesBoxPlot*.**decorate**(*decorateFunc*)
If *decorateFunc* is specified, sets the decorator function to the specified function, and returns this series. If *decorateFunc* is not specified, returns the current decorator function.
# *seriesBoxplot*.**context**(*ctx*)
The SVG implementation does not support this property.
If *ctx* is specified, sets the canvas context and returns this series. If *ctx* is not specified, returns the current context.
# *seriesBoxplot*.**lineWidth**(*width*)
The SVG and canvas implementations do not support this property.
If *width* is specified, sets the line width and returns this series. If *width* is not specified, returns the current line width.
# *seriesBoxplot*.**equals**(*equals*)
The SVG and canvas implementations do not support this property.
If *equals* is specified, sets the equality function used to compare *previousData* with *data*. The result of this check is used to control whether the data is reprojected and rescaled. If *equals* is not specified, returns the current equality function which defaults to always returning false indicating the data has changed.
# *seriesBoxp*.**pixelRatio**(*pixelRatio*)
The SVG and canvas implementations do not support this property.
If *pixelRatio* is specified, sets the factor used to scale any pixel values. If *pixelRatio* is not specified returns the current value.
# *seriesBoxplot*.**scaleMapper**(*scaleMapper*)
The SVG and canvas implementations do not support this property.
If *scaleMapper* is specified, sets the function used to map first the xScale and then the yScale onto matched pairs of JavaScript and WebGL implementations. If *equals* is not specified, returns the current scale mapper which defaults to [webglScaleMapper](https://github.com/d3fc/d3fc/tree/master/packages/d3fc-webgl#webglScaleMapper).
The returned JavaScript scale is equality checked using a reference comparison to determine whether the data needs to be rescaled. If the reference is the same as the previous render, the values associated with the scale are not rescaled.
### Errorbar
# fc.**seriesSvgBoxPlot**()
# fc.**seriesCanvasBoxPlot**()
# fc.**seriesWebglBoxPlot**()
Constructs a new boxplot renderer for canvas, WebGL or SVG.
#### Common properties
# *seriesBoxPlot*.**crossValue**(*accessorFunc*)
# *seriesBoxPlot*.**medianValue**(*accessorFunc*)
# *seriesBoxPlot*.**upperQuartileValue**(*accessorFunc*)
# *seriesBoxPlot*.**lowerQuartileValue**(*accessorFunc*)
# *seriesBoxPlot*.**highValue**(*accessorFunc*)
# *seriesBoxPlot*.**lowValue**(*accessorFunc*)
If *accessorFunc* is specified, sets the accessor to the specified function and returns this series. If *accessorFunc* is not specified, returns the current accessor. The `accessorFunc(datum, index)` function is called on each item of the data, returning the relevant value for the given accessor. The respective scale is applied to the value returned by the accessor before rendering.
# *seriesBoxPlot*.**orient**(*orientation*)
The WebGL implementation does not support this property.
If *orientation* is specified, sets the orientation and returns this series. If *orientation* is not specified, returns the current orientation. The orientation value should be either `horizontal` (default) or `vertical`
# *seriesBoxPlot*.**xScale**(*scale*)
# *seriesBoxPlot*.**yScale**(*scale*)
If *scale* is specified, sets the scale and returns this series. If *scale* is not specified, returns the current scale.
# *seriesBoxPlot*.**bandwidth**(*bandwidthFunc*)
If *bandwidthFunc* is specified, sets the bandwidth function and returns this series. If *bandwidthFunc* is not specified, returns the current bandwidth function.
# *seriesBoxPlot*.**align**(*alignment*)
The WebGL implementation does not support this property.
If *alignment* is specified, sets the alignment and returns this series. If *alignment* is not specified, returns the current alignment. The alignment value should be `left`, `right` or `center` (default) and describes how the alignment of each boxplot with respect to the central value.
# *seriesBoxPlot*.**cap**(*capFunc*)
If *capFunc* is specified, sets the cap function and returns this series. If *capFunc* is not specified, returns the current cap function. The `capFunc(item, index)` function is called on each item of the data, and returns the **proportion** of the box width that the caps width should be.
# *seriesBoxPlot*.**decorate**(*decorateFunc*)
If *decorateFunc* is specified, sets the decorator function to the specified function, and returns this series. If *decorateFunc* is not specified, returns the current decorator function.
# *seriesBoxplot*.**context**(*ctx*)
The SVG implementation does not support this property.
If *ctx* is specified, sets the canvas context and returns this series. If *ctx* is not specified, returns the current context.
# *seriesBoxplot*.**lineWidth**(*width*)
The SVG and canvas implementations do not support this property.
If *width* is specified, sets the line width and returns this series. If *width* is not specified, returns the current line width.
# *seriesBoxplot*.**equals**(*equals*)
The SVG and canvas implementations do not support this property.
If *equals* is specified, sets the equality function used to compare *previousData* with *data*. The result of this check is used to control whether the data is reprojected and rescaled. If *equals* is not specified, returns the current equality function which defaults to always returning false indicating the data has changed.
# *seriesBoxp*.**pixelRatio**(*pixelRatio*)
The SVG and canvas implementations do not support this property.
If *pixelRatio* is specified, sets the factor used to scale any pixel values. If *pixelRatio* is not specified returns the current value.
# *seriesBoxplot*.**scaleMapper**(*scaleMapper*)
The SVG and canvas implementations do not support this property.
If *scaleMapper* is specified, sets the function used to map first the xScale and then the yScale onto matched pairs of JavaScript and WebGL implementations. If *equals* is not specified, returns the current scale mapper which defaults to [webglScaleMapper](https://github.com/d3fc/d3fc/tree/master/packages/d3fc-webgl#webglScaleMapper).
The returned JavaScript scale is equality checked using a reference comparison to determine whether the data needs to be rescaled. If the reference is the same as the previous render, the values associated with the scale are not rescaled.
### Errorbar
 # fc.**seriesSvgErrorBar**()
# fc.**seriesCanvasErrorBar**()
# fc.**seriesWebglErrorBar**()
Constructs a new error bar renderer for canvas, WebGL or SVG.
#### Common properties
# *seriesErrorBar*.**crossValue**(*accessorFunc*)
# *seriesErrorBar*.**highValue**(*accessorFunc*)
# *seriesErrorBar*.**lowValue**(*accessorFunc*)
If *accessorFunc* is specified, sets the accessor to the specified function and returns this series. If *accessorFunc* is not specified, returns the current accessor. The `accessorFunc(datum, index)` function is called on each item of the data, returning the relevant value for the given accessor. The respective scale is applied to the value returned by the accessor before rendering.
# *seriesErrorBar*.**orient**(*orientation*)
The SVG implementation does not support this property.
If *orientation* is specified, sets the orientation and returns this series. If *orientation* is not specified, returns the current orientation. The orientation value should be either `horizontal` (default) or `vertical`
# *seriesErrorBar*.**xScale**(*scale*)
# *seriesErrorBar*.**yScale**(*scale*)
If *scale* is specified, sets the scale and returns this series. If *scale* is not specified, returns the current scale.
# *seriesErrorBar*.**bandwidth**(*bandwidthFunc*)
If *bandwidthFunc* is specified, sets the bandwidth function and returns this series. If *bandwidthFunc* is not specified, returns the current bandwidth function.
# *seriesErrorBar*.**align**(*alignment*)
The WebGL implementation does not support this property.
If *alignment* is specified, sets the alignment and returns this series. If *alignment* is not specified, returns the current alignment. The alignment value should be `left`, `right` or `center` (default) and describes how the alignment of each errorbar with respect to the central value.
# *seriesErrorBar*.**decorate**(*decorateFunc*)
If *decorateFunc* is specified, sets the decorator function to the specified function, and returns this series. If *decorateFunc* is not specified, returns the current decorator function.
# *seriesErrorBar*.**context**(*ctx*)
The SVG implementation does not support this property.
If *ctx* is specified, sets the canvas context and returns this series. If *ctx* is not specified, returns the current context.
# *seriesErrorBar*.**lineWidth**(*width*)
The SVG and canvas implementations do not support this property.
If *width* is specified, sets the line width and returns this series. If *width* is not specified, returns the current line width.
# *seriesErrorBar*.**equals**(*equals*)
The SVG and canvas implementations do not support this property.
If *equals* is specified, sets the equality function used to compare *previousData* with *data*. The result of this check is used to control whether the data is reprojected and rescaled. If *equals* is not specified, returns the current equality function which defaults to always returning false indicating the data has changed.
# *seriesErro*.**pixelRatio**(*pixelRatio*)
The SVG and canvas implementations do not support this property.
If *pixelRatio* is specified, sets the factor used to scale any pixel values. If *pixelRatio* is not specified returns the current value.
# *seriesErrorBar*.**scaleMapper**(*scaleMapper*)
The SVG and canvas implementations do not support this property.
If *scaleMapper* is specified, sets the function used to map first the xScale and then the yScale onto matched pairs of JavaScript and WebGL implementations. If *equals* is not specified, returns the current scale mapper which defaults to [webglScaleMapper](https://github.com/d3fc/d3fc/tree/master/packages/d3fc-webgl#webglScaleMapper).
The returned JavaScript scale is equality checked using a reference comparison to determine whether the data needs to be rescaled. If the reference is the same as the previous render, the values associated with the scale are not rescaled.
### Heatmap
# fc.**seriesSvgErrorBar**()
# fc.**seriesCanvasErrorBar**()
# fc.**seriesWebglErrorBar**()
Constructs a new error bar renderer for canvas, WebGL or SVG.
#### Common properties
# *seriesErrorBar*.**crossValue**(*accessorFunc*)
# *seriesErrorBar*.**highValue**(*accessorFunc*)
# *seriesErrorBar*.**lowValue**(*accessorFunc*)
If *accessorFunc* is specified, sets the accessor to the specified function and returns this series. If *accessorFunc* is not specified, returns the current accessor. The `accessorFunc(datum, index)` function is called on each item of the data, returning the relevant value for the given accessor. The respective scale is applied to the value returned by the accessor before rendering.
# *seriesErrorBar*.**orient**(*orientation*)
The SVG implementation does not support this property.
If *orientation* is specified, sets the orientation and returns this series. If *orientation* is not specified, returns the current orientation. The orientation value should be either `horizontal` (default) or `vertical`
# *seriesErrorBar*.**xScale**(*scale*)
# *seriesErrorBar*.**yScale**(*scale*)
If *scale* is specified, sets the scale and returns this series. If *scale* is not specified, returns the current scale.
# *seriesErrorBar*.**bandwidth**(*bandwidthFunc*)
If *bandwidthFunc* is specified, sets the bandwidth function and returns this series. If *bandwidthFunc* is not specified, returns the current bandwidth function.
# *seriesErrorBar*.**align**(*alignment*)
The WebGL implementation does not support this property.
If *alignment* is specified, sets the alignment and returns this series. If *alignment* is not specified, returns the current alignment. The alignment value should be `left`, `right` or `center` (default) and describes how the alignment of each errorbar with respect to the central value.
# *seriesErrorBar*.**decorate**(*decorateFunc*)
If *decorateFunc* is specified, sets the decorator function to the specified function, and returns this series. If *decorateFunc* is not specified, returns the current decorator function.
# *seriesErrorBar*.**context**(*ctx*)
The SVG implementation does not support this property.
If *ctx* is specified, sets the canvas context and returns this series. If *ctx* is not specified, returns the current context.
# *seriesErrorBar*.**lineWidth**(*width*)
The SVG and canvas implementations do not support this property.
If *width* is specified, sets the line width and returns this series. If *width* is not specified, returns the current line width.
# *seriesErrorBar*.**equals**(*equals*)
The SVG and canvas implementations do not support this property.
If *equals* is specified, sets the equality function used to compare *previousData* with *data*. The result of this check is used to control whether the data is reprojected and rescaled. If *equals* is not specified, returns the current equality function which defaults to always returning false indicating the data has changed.
# *seriesErro*.**pixelRatio**(*pixelRatio*)
The SVG and canvas implementations do not support this property.
If *pixelRatio* is specified, sets the factor used to scale any pixel values. If *pixelRatio* is not specified returns the current value.
# *seriesErrorBar*.**scaleMapper**(*scaleMapper*)
The SVG and canvas implementations do not support this property.
If *scaleMapper* is specified, sets the function used to map first the xScale and then the yScale onto matched pairs of JavaScript and WebGL implementations. If *equals* is not specified, returns the current scale mapper which defaults to [webglScaleMapper](https://github.com/d3fc/d3fc/tree/master/packages/d3fc-webgl#webglScaleMapper).
The returned JavaScript scale is equality checked using a reference comparison to determine whether the data needs to be rescaled. If the reference is the same as the previous render, the values associated with the scale are not rescaled.
### Heatmap
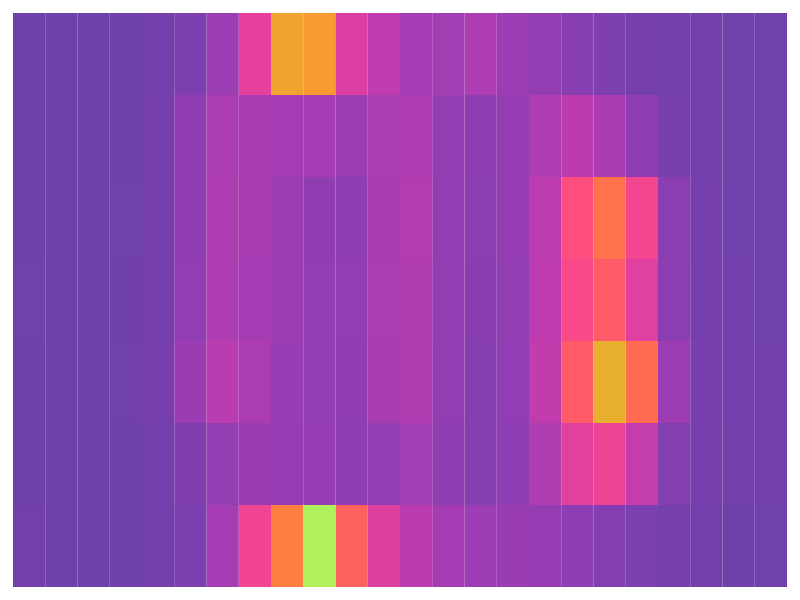 # fc.**seriesSvgHeatmap**()
# fc.**seriesCanvasHeatmap**()
Constructs a new heatmap series renderer for either canvas or SVG.
#### Common properties
# *seriesHeatmap*.**crossValue**(*accessorFunc*)
# *seriesHeatmap*.**highValue**(*accessorFunc*)
# *seriesHeatmap*.**colorValue**(*accessorFunc*)
If *accessorFunc* is specified, sets the accessor to the specified function and returns this series. If *accessorFunc* is not specified, returns the current accessor. The `accessorFunc(datum, index)` function is called on each item of the data, returning the relevant value for the given accessor. The respective scale is applied to the value returned by the accessor before rendering.
# *seriesHeatmap*.**xScale**(*scale*)
# *seriesHeatmap*.**yScale**(*scale*)
If *scale* is specified, sets the scale and returns this series. If *scale* is not specified, returns the current scale.
# *seriesHeatmap*.**colorInterpolate**(*interpolate*)
If *colorInterpolate* is specified, sets the interpolator used to map color values to colors and returns this series. If *colorInterpolate* is not specified, returns the current interpolator.
# *seriesHeatmap*.**xBandwidth**(*bandwidthFunc*)
# *seriesHeatmap*.**yBandwidth**(*bandwidthFunc*)
If *bandwidthFunc* is specified, sets the bandwidth function and returns this series. If *bandwidthFunc* is not specified, returns the current bandwidth function.
# *seriesHeatmap*.**yAlign**(*alignment*)
# *seriesHeatmap*.**xAlign**(*alignment*)
The WebGL implementation does not support this property.
If *alignment* is specified, sets the alignment and returns this series. If *alignment* is not specified, returns the current alignment. The alignment value should be `left`, `right` or `center` (default) and describes how the alignment of each heatmap cell with respect to the central value.
# *seriesHeatmap*.**decorate**(*decorateFunc*)
If *decorateFunc* is specified, sets the decorator function to the specified function, and returns this series. If *decorateFunc* is not specified, returns the current decorator function.
# *seriesErrorBar*.**context**(*ctx*)
The SVG implementation does not support this property.
If *ctx* is specified, sets the canvas context and returns this series. If *ctx* is not specified, returns the current context.
### Multi
# fc.**seriesSvgHeatmap**()
# fc.**seriesCanvasHeatmap**()
Constructs a new heatmap series renderer for either canvas or SVG.
#### Common properties
# *seriesHeatmap*.**crossValue**(*accessorFunc*)
# *seriesHeatmap*.**highValue**(*accessorFunc*)
# *seriesHeatmap*.**colorValue**(*accessorFunc*)
If *accessorFunc* is specified, sets the accessor to the specified function and returns this series. If *accessorFunc* is not specified, returns the current accessor. The `accessorFunc(datum, index)` function is called on each item of the data, returning the relevant value for the given accessor. The respective scale is applied to the value returned by the accessor before rendering.
# *seriesHeatmap*.**xScale**(*scale*)
# *seriesHeatmap*.**yScale**(*scale*)
If *scale* is specified, sets the scale and returns this series. If *scale* is not specified, returns the current scale.
# *seriesHeatmap*.**colorInterpolate**(*interpolate*)
If *colorInterpolate* is specified, sets the interpolator used to map color values to colors and returns this series. If *colorInterpolate* is not specified, returns the current interpolator.
# *seriesHeatmap*.**xBandwidth**(*bandwidthFunc*)
# *seriesHeatmap*.**yBandwidth**(*bandwidthFunc*)
If *bandwidthFunc* is specified, sets the bandwidth function and returns this series. If *bandwidthFunc* is not specified, returns the current bandwidth function.
# *seriesHeatmap*.**yAlign**(*alignment*)
# *seriesHeatmap*.**xAlign**(*alignment*)
The WebGL implementation does not support this property.
If *alignment* is specified, sets the alignment and returns this series. If *alignment* is not specified, returns the current alignment. The alignment value should be `left`, `right` or `center` (default) and describes how the alignment of each heatmap cell with respect to the central value.
# *seriesHeatmap*.**decorate**(*decorateFunc*)
If *decorateFunc* is specified, sets the decorator function to the specified function, and returns this series. If *decorateFunc* is not specified, returns the current decorator function.
# *seriesErrorBar*.**context**(*ctx*)
The SVG implementation does not support this property.
If *ctx* is specified, sets the canvas context and returns this series. If *ctx* is not specified, returns the current context.
### Multi
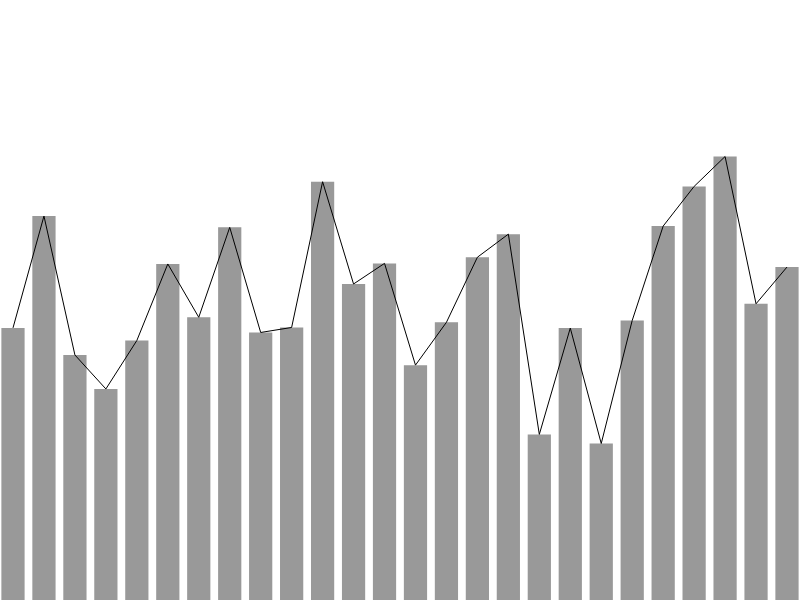 # fc.**seriesSvgMulti**()
# fc.**seriesCanvasMulti**()
# fc.**seriesWebglMulti**()
Constructs a new multi series renderer for canvas, WebGL or SVG.
#### Common properties
# *seriesMulti*.**series**(*seriesArray*)
If *seriesArray* is specified, sets the array of series that this multi series should render and returns this series. If *seriesArray* is not specified, returns the current array of series.
# *seriesMulti*.**xScale**(*scale*)
# *seriesMulti*.**yScale**(*scale*)
If *scale* is specified, sets the scale and returns this series. If *scale* is not specified, returns the current scale.
# *seriesMulti*.**mapping**(*mappingFunc*)
If *mappingFunc* is specified, sets the mapping function to the specified function, and returns this series. If *mappingFunc* is not specified, returns the current mapping function.
When rendering the multi-series, the mapping function is invoked once for each of the series supplied via the *series* property. The purpose of the mapping function is to return the data supplied to each of these series. The default mapping is the identity function, `(d) => d`, which results in each series being supplied with the same data as the multi-series component.
The mapping function is invoked with the data bound to the multi-series, (*data*), the index of the current series (*index*) and the array of series (*series*). A common pattern for the mapping function is to switch on the series type. For example, a multi-series could be used to render a line series together with an upper bound, indicated by a line annotation. In this case, the following would be a suitable mapping function:
```javascript
const multi = fc.seriesSvgMulti()
.series([line, annotation)
.mapping((data, index, series) => {
switch(series[index]) {
case line:
return data.line;
case annotation:
return data.upperBound;
}
});
```
# *seriesMulti*.**decorate**(*decorateFunc*)
If *decorateFunc* is specified, sets the decorator function to the specified function, and returns this series. If *decorateFunc* is not specified, returns the current decorator function.
With the SVG multi series, the decorate function is invoked once, with the data join selection that creates the outer container. With the canvas multi series the decorate function is invoked for each of the associated series.
# *seriesMulti*.**context**(*ctx*)
The SVG implementation does not support this property.
If *ctx* is specified, sets the canvas context and returns this series. If *ctx* is not specified, returns the current context.
### Repeat
# fc.**seriesSvgMulti**()
# fc.**seriesCanvasMulti**()
# fc.**seriesWebglMulti**()
Constructs a new multi series renderer for canvas, WebGL or SVG.
#### Common properties
# *seriesMulti*.**series**(*seriesArray*)
If *seriesArray* is specified, sets the array of series that this multi series should render and returns this series. If *seriesArray* is not specified, returns the current array of series.
# *seriesMulti*.**xScale**(*scale*)
# *seriesMulti*.**yScale**(*scale*)
If *scale* is specified, sets the scale and returns this series. If *scale* is not specified, returns the current scale.
# *seriesMulti*.**mapping**(*mappingFunc*)
If *mappingFunc* is specified, sets the mapping function to the specified function, and returns this series. If *mappingFunc* is not specified, returns the current mapping function.
When rendering the multi-series, the mapping function is invoked once for each of the series supplied via the *series* property. The purpose of the mapping function is to return the data supplied to each of these series. The default mapping is the identity function, `(d) => d`, which results in each series being supplied with the same data as the multi-series component.
The mapping function is invoked with the data bound to the multi-series, (*data*), the index of the current series (*index*) and the array of series (*series*). A common pattern for the mapping function is to switch on the series type. For example, a multi-series could be used to render a line series together with an upper bound, indicated by a line annotation. In this case, the following would be a suitable mapping function:
```javascript
const multi = fc.seriesSvgMulti()
.series([line, annotation)
.mapping((data, index, series) => {
switch(series[index]) {
case line:
return data.line;
case annotation:
return data.upperBound;
}
});
```
# *seriesMulti*.**decorate**(*decorateFunc*)
If *decorateFunc* is specified, sets the decorator function to the specified function, and returns this series. If *decorateFunc* is not specified, returns the current decorator function.
With the SVG multi series, the decorate function is invoked once, with the data join selection that creates the outer container. With the canvas multi series the decorate function is invoked for each of the associated series.
# *seriesMulti*.**context**(*ctx*)
The SVG implementation does not support this property.
If *ctx* is specified, sets the canvas context and returns this series. If *ctx* is not specified, returns the current context.
### Repeat
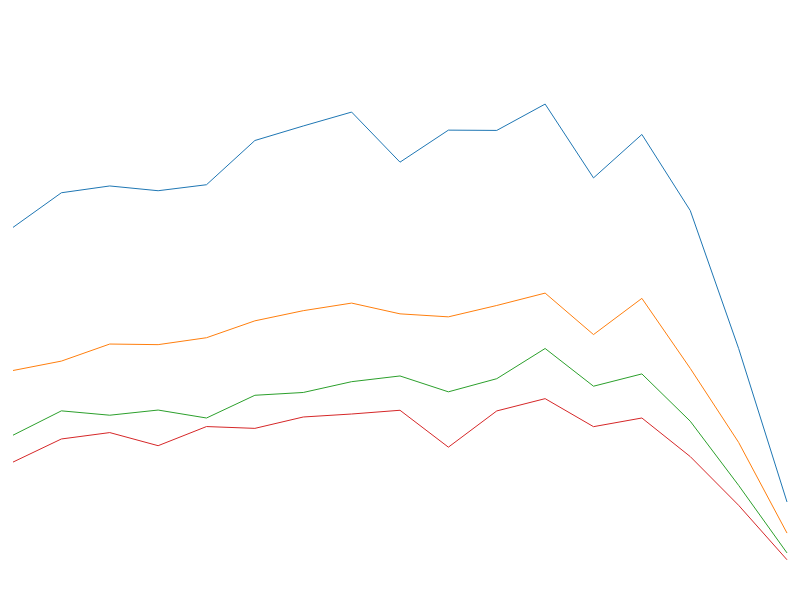 # fc.**seriesSvgRepeat**()
# fc.**seriesCanvasRepeat**()
# fc.**seriesWebglRepeat**()
Constructs a new repeat series renderer for canvas, WebGL or SVG.
The repeat series is very similar in function to the multi series, both are designed to render multiple series from the same bound data. The repeat series uses the same series type for each data series, e.g. multiple lines series, or multiple area series.
The repeat series expects the data to be presented as an array of arrays. The following example demonstrates how it can be used to render multiple line series:
```javascript
const data = [
[1, 3, 4],
[4, 5, 6]
];
const line = fc.seriesSvgLine();
const repeatSeries = fc.seriesSvgRepeat()
.xScale(xScale)
.yScale(yScale)
.series(line);
d3.select('g')
.datum(data)
.call(repeatSeries);
```
The repeat series also exposes an *orient* property which determines the 'orientation' of the series within the bound data. In the above example, setting orient to *horizontal* would result in the data being rendered as two series of three points (rather than three series of two points).
#### Common properties
# *seriesRepeat*.**series**(*series*)
If *series* is specified, sets the series that this repeat series should render and returns this series. If *series* is not specified, returns the current series.
For the WebGL implementation only, *series* can be specified as a function which when invoked returns a new series instance. This allows the repeat series to allocate a series instance per data series, preventing the unnecessary cache-evictions which can occur if only one series instance is used.
# *seriesRepeat*.**orient**(*orientation*)
If *orientation* is specified, sets the orientation and returns this series. If *orientation* is not specified, returns the current orientation. The orientation value should be either `vertical` (default) or `horizontal`.
# *seriesRepeat*.**xScale**(*scale*)
# *seriesRepeat*.**yScale**(*scale*)
# *seriesRepeat*.**decorate**(*decorateFunc*)
# *seriesRepeat*.**context**(*ctx*)
Please refer to the multi series for the documentation of these properties.
### Grouped
# fc.**seriesSvgRepeat**()
# fc.**seriesCanvasRepeat**()
# fc.**seriesWebglRepeat**()
Constructs a new repeat series renderer for canvas, WebGL or SVG.
The repeat series is very similar in function to the multi series, both are designed to render multiple series from the same bound data. The repeat series uses the same series type for each data series, e.g. multiple lines series, or multiple area series.
The repeat series expects the data to be presented as an array of arrays. The following example demonstrates how it can be used to render multiple line series:
```javascript
const data = [
[1, 3, 4],
[4, 5, 6]
];
const line = fc.seriesSvgLine();
const repeatSeries = fc.seriesSvgRepeat()
.xScale(xScale)
.yScale(yScale)
.series(line);
d3.select('g')
.datum(data)
.call(repeatSeries);
```
The repeat series also exposes an *orient* property which determines the 'orientation' of the series within the bound data. In the above example, setting orient to *horizontal* would result in the data being rendered as two series of three points (rather than three series of two points).
#### Common properties
# *seriesRepeat*.**series**(*series*)
If *series* is specified, sets the series that this repeat series should render and returns this series. If *series* is not specified, returns the current series.
For the WebGL implementation only, *series* can be specified as a function which when invoked returns a new series instance. This allows the repeat series to allocate a series instance per data series, preventing the unnecessary cache-evictions which can occur if only one series instance is used.
# *seriesRepeat*.**orient**(*orientation*)
If *orientation* is specified, sets the orientation and returns this series. If *orientation* is not specified, returns the current orientation. The orientation value should be either `vertical` (default) or `horizontal`.
# *seriesRepeat*.**xScale**(*scale*)
# *seriesRepeat*.**yScale**(*scale*)
# *seriesRepeat*.**decorate**(*decorateFunc*)
# *seriesRepeat*.**context**(*ctx*)
Please refer to the multi series for the documentation of these properties.
### Grouped
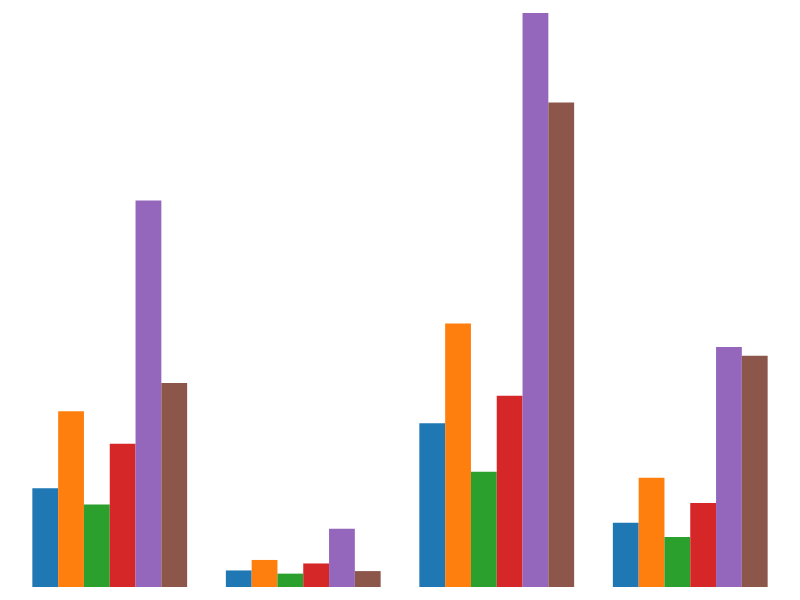 # fc.**seriesSvgGrouped**(*adaptedSeries*)
# fc.**seriesCanvasGrouped**(*adaptedSeries*)
Constructs a new grouped series by adapting the given series. This allows the rendering of grouped bars, boxplots and point series etc ...
The grouped series is responsible for applying a suitable offset, along the cross-axis, to create clustered groups of bars (or points etc ...). The grouped series rebinds all of the properties of the adapted series.
The following example shows the construction of a grouped bar series, where the scales and value accessors are configured:
```javascript
var groupedBar = fc.seriesSvgGrouped(fc.seriesSvgBar())
.xScale(x)
.yScale(y)
.crossValue(d => d[0])
.mainValue(d => d[1]);
```
Rendering a grouped series requires a nested array of data, the default format expected by the grouped series expects each object in the array to have a `values` property with the nested data, however, this can be configured by the `values` accessor.
```javascript
[
{
"key": "Under 5 Years",
"values": [
{ "x": "AL", "y": 310 },
{ "x": "AK", "y": 52 },
{ "x": "AZ", "y": 515 }
]
},
{
"key": "5 to 13 Years",
"values": [
{ "x": "AL", "y": 552 },
{ "x": "AK", "y": 85 },
{ "x": "AZ", "y": 828 }
]
}
]
```
The `fc.group` component from the [d3fc-group](https://github.com/d3fc/d3fc/tree/master/packages/d3fc-group#d3fc-group) package gives an easy way to construct this data from CSV / TSV.
With the data in the correct format, the series is rendered just like the other series types:
```javascript
container.append('g')
.datum(series)
.call(groupedBar);
```
And the grouped canvas series is rendered as follows:
```javascript
groupedCanvasBar(series);
```
#### Common properties
# *grouped*.**bandwidth**(*bandwidthFunc*)
If *bandwidthFunc* is specified, sets the bandwidth function and returns this series. If *bandwidthFunc* is not specified, returns the current bandwidth function.
# *grouped*.**subPadding**(*padding*)
If *padding* is specified, sets the sub-padding to the specified value which must be in the range [0, 1]. If *padding* is not specified, returns the current sub-padding. The sub-padding value determines the padding between the bars within each group.
### Stacked
# fc.**seriesSvgGrouped**(*adaptedSeries*)
# fc.**seriesCanvasGrouped**(*adaptedSeries*)
Constructs a new grouped series by adapting the given series. This allows the rendering of grouped bars, boxplots and point series etc ...
The grouped series is responsible for applying a suitable offset, along the cross-axis, to create clustered groups of bars (or points etc ...). The grouped series rebinds all of the properties of the adapted series.
The following example shows the construction of a grouped bar series, where the scales and value accessors are configured:
```javascript
var groupedBar = fc.seriesSvgGrouped(fc.seriesSvgBar())
.xScale(x)
.yScale(y)
.crossValue(d => d[0])
.mainValue(d => d[1]);
```
Rendering a grouped series requires a nested array of data, the default format expected by the grouped series expects each object in the array to have a `values` property with the nested data, however, this can be configured by the `values` accessor.
```javascript
[
{
"key": "Under 5 Years",
"values": [
{ "x": "AL", "y": 310 },
{ "x": "AK", "y": 52 },
{ "x": "AZ", "y": 515 }
]
},
{
"key": "5 to 13 Years",
"values": [
{ "x": "AL", "y": 552 },
{ "x": "AK", "y": 85 },
{ "x": "AZ", "y": 828 }
]
}
]
```
The `fc.group` component from the [d3fc-group](https://github.com/d3fc/d3fc/tree/master/packages/d3fc-group#d3fc-group) package gives an easy way to construct this data from CSV / TSV.
With the data in the correct format, the series is rendered just like the other series types:
```javascript
container.append('g')
.datum(series)
.call(groupedBar);
```
And the grouped canvas series is rendered as follows:
```javascript
groupedCanvasBar(series);
```
#### Common properties
# *grouped*.**bandwidth**(*bandwidthFunc*)
If *bandwidthFunc* is specified, sets the bandwidth function and returns this series. If *bandwidthFunc* is not specified, returns the current bandwidth function.
# *grouped*.**subPadding**(*padding*)
If *padding* is specified, sets the sub-padding to the specified value which must be in the range [0, 1]. If *padding* is not specified, returns the current sub-padding. The sub-padding value determines the padding between the bars within each group.
### Stacked
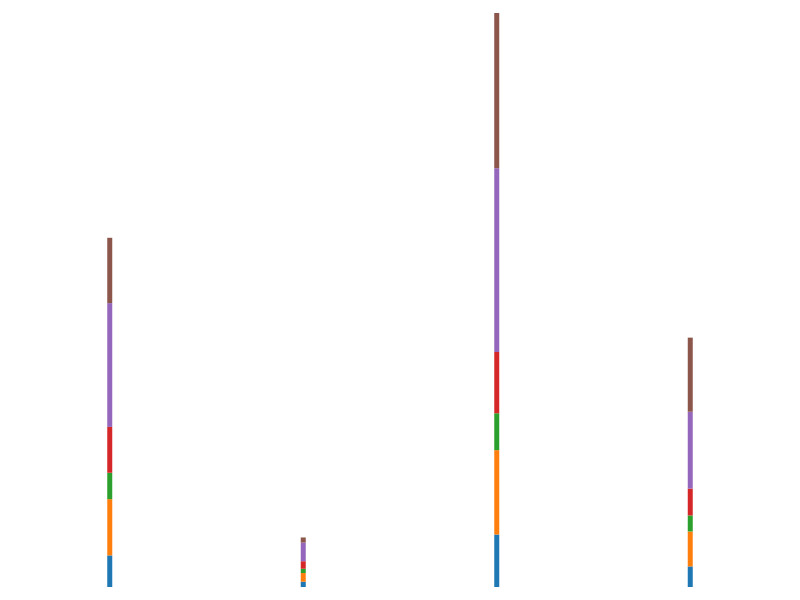 There is not an explicit series type for rendering stacked charts, it is a straightforward task to render stacked series with the existing components. This section illustrates this with a few examples.
The following code demonstrates how to render a stacked bar series to an SVG. Note that the axis configuration is omitted for clarity:
```javascript
var stack = d3.stack()
.keys(Object.keys(data[0]).filter(k => k !== 'State'));
var series = stack(data);
var color = d3.scaleOrdinal(d3.schemeCategory10);
var barSeries = fc.seriesSvgBar()
.xScale(x)
.yScale(y)
.crossValue(d => d.data.State)
.mainValue(d => d[1])
.baseValue(d => d[0])
.decorate((group, data, index) => {
group.selectAll('path')
.attr('fill', color(index));
})
var join = fc.dataJoin('g', 'series');
join(container, series)
.call(barSeries);
```
The [d3 stack](https://github.com/d3/d3-shape/blob/master/README.md#stack) component is used to stack the data obtained from the D3 CSV parser. The SVG bar series value accessors are configured based on the output of the stack component. Finally a D3FC datajoin is used to render each row of data using the bar series.
With canvas, the code is very similar, with a for each loop used in place of the data join:
```javascript
var canvasBarSeries = fc.seriesCanvasBar()
.xScale(x)
.yScale(y)
.crossValue(d => d.data.State)
.mainValue(d => d[1])
.baseValue(d => d[0])
.context(ctx);
series.forEach(function(s, i) {
canvasBarSeries
.decorate(function(ctx) {
ctx.fillStyle = color(i);
})(s);
});
```
With WebGL, the code is also very similar:
```javascript
var webglBarSeries = fc.seriesWebglBar()
.xScale(x)
.yScale(y)
.crossValue(d => d.data.State)
.mainValue(d => d[1])
.baseValue(d => d[0])
.context(ctx);
series.forEach(function(s, i) {
webglBarSeries
.decorate(function(program) {
fc.barFill().color(color(i))(program);
})(s);
});
```
In all cases, the decorate pattern is used to set the color for each bar series.
There is not an explicit series type for rendering stacked charts, it is a straightforward task to render stacked series with the existing components. This section illustrates this with a few examples.
The following code demonstrates how to render a stacked bar series to an SVG. Note that the axis configuration is omitted for clarity:
```javascript
var stack = d3.stack()
.keys(Object.keys(data[0]).filter(k => k !== 'State'));
var series = stack(data);
var color = d3.scaleOrdinal(d3.schemeCategory10);
var barSeries = fc.seriesSvgBar()
.xScale(x)
.yScale(y)
.crossValue(d => d.data.State)
.mainValue(d => d[1])
.baseValue(d => d[0])
.decorate((group, data, index) => {
group.selectAll('path')
.attr('fill', color(index));
})
var join = fc.dataJoin('g', 'series');
join(container, series)
.call(barSeries);
```
The [d3 stack](https://github.com/d3/d3-shape/blob/master/README.md#stack) component is used to stack the data obtained from the D3 CSV parser. The SVG bar series value accessors are configured based on the output of the stack component. Finally a D3FC datajoin is used to render each row of data using the bar series.
With canvas, the code is very similar, with a for each loop used in place of the data join:
```javascript
var canvasBarSeries = fc.seriesCanvasBar()
.xScale(x)
.yScale(y)
.crossValue(d => d.data.State)
.mainValue(d => d[1])
.baseValue(d => d[0])
.context(ctx);
series.forEach(function(s, i) {
canvasBarSeries
.decorate(function(ctx) {
ctx.fillStyle = color(i);
})(s);
});
```
With WebGL, the code is also very similar:
```javascript
var webglBarSeries = fc.seriesWebglBar()
.xScale(x)
.yScale(y)
.crossValue(d => d.data.State)
.mainValue(d => d[1])
.baseValue(d => d[0])
.context(ctx);
series.forEach(function(s, i) {
webglBarSeries
.decorate(function(program) {
fc.barFill().color(color(i))(program);
})(s);
});
```
In all cases, the decorate pattern is used to set the color for each bar series.