| 1 | # geotiff.js
|
| 2 | [](https://travis-ci.org/geotiffjs/geotiff.js) [](https://www.versioneye.com/user/projects/566af91d4e049b0041000083) [](https://badge.fury.io/js/geotiff)
|
| 3 |
|
| 4 | Read (geospatial) metadata and raw array data from a wide variety of different
|
| 5 | (Geo)TIFF files types.
|
| 6 |
|
| 7 | ## Features
|
| 8 |
|
| 9 | Currently available functionality:
|
| 10 |
|
| 11 | * Parsing TIFFs from various sources:
|
| 12 | * remote (via `fetch` or XHR)
|
| 13 | * from a local `ArrayBuffer`
|
| 14 | * from the filesystem (on Browsers using the `FileReader` and on node using the filesystem functions)
|
| 15 | * Parsing the headers of all possible TIFF files
|
| 16 | * Rudimentary extraction of geospatial metadata
|
| 17 | * Reading raster data from:
|
| 18 | * stripped images
|
| 19 | * tiled images
|
| 20 | * band interleaved images
|
| 21 | * pixel interleaved images
|
| 22 | * Supported data-types:
|
| 23 | * (U)Int8/16/32
|
| 24 | * Float32/64
|
| 25 | * Enabled compressions:
|
| 26 | * no compression
|
| 27 | * Packbits
|
| 28 | * LZW
|
| 29 | * Deflate (with floating point or horizontal predictor support)
|
| 30 | * JPEG
|
| 31 | * Automatic selection of overview level to read from
|
| 32 | * Subsetting via an image window or bounding box and selected bands
|
| 33 | * Reading of samples into separate arrays or a single pixel-interleaved array
|
| 34 | * Configurable tile/strip cache
|
| 35 | * Configurable Pool of workers to increase decoding efficiency
|
| 36 | * Utility functions for geospatial parameters (Bounding Box, Origin, Resolution)
|
| 37 | * Limited [bigTIFF](http://bigtiff.org/#FILE_FORMAT) support
|
| 38 | * Automated testing via PhantomJS
|
| 39 |
|
| 40 | Further documentation can be found [here](https://geotiffjs.github.io/geotiff.js/).
|
| 41 |
|
| 42 | ## Example Usage
|
| 43 |
|
| 44 | * [Slice view using Cesium.js (TAMP project)](http://www.youtube.com/watch?v=E6kFLtKgeJ8)
|
| 45 |
|
| 46 | [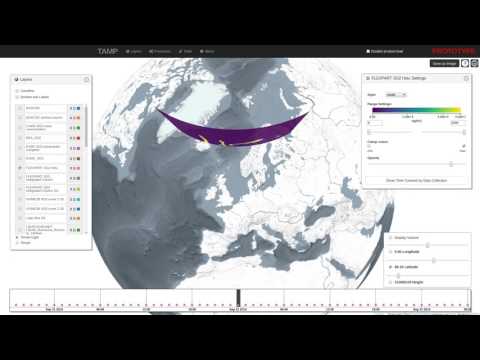](http://www.youtube.com/watch?v=E6kFLtKgeJ8)
|
| 47 |
|
| 48 | * [Contour generation using d3-contour](https://bl.ocks.org/mbostock/83c0be21dba7602ee14982b020b12f51)
|
| 49 |
|
| 50 | [](https://bl.ocks.org/mbostock/83c0be21dba7602ee14982b020b12f51)
|
| 51 |
|
| 52 | ## Setup
|
| 53 |
|
| 54 | To setup the repository do the following steps:
|
| 55 |
|
| 56 | ```bash
|
| 57 | # clone repo
|
| 58 | git clone https://github.com/constantinius/geotiff.js.git
|
| 59 | cd geotiff.js/
|
| 60 |
|
| 61 | # install development dependencies
|
| 62 | npm install
|
| 63 | ```
|
| 64 |
|
| 65 | ## Testing and Building
|
| 66 |
|
| 67 | In order to run the tests you first have to set up the test data. This requires
|
| 68 | the [GDAL](http://gdal.org/) and [ImageMagick](http://imagemagick.org/) tools.
|
| 69 | Installation of these tools varies according to the operating system, the
|
| 70 | following listing shows the installation on Ubuntu (using the ubuntugis-unstable
|
| 71 | repository):
|
| 72 | ```bash
|
| 73 | sudo add-apt-repository -y ppa:ubuntugis/ubuntugis-unstable
|
| 74 | sudo apt-get update
|
| 75 | sudo apt-get install -y gdal-bin imagemagick
|
| 76 | ```
|
| 77 |
|
| 78 | When GDAL and ImageMagick is installed, the test data setup script can be run:
|
| 79 | ```bash
|
| 80 | cd test/data
|
| 81 | sh setup_data.sh
|
| 82 | cd -
|
| 83 | ```
|
| 84 |
|
| 85 | To test the library (using PhantomJS, karma, mocha and chai) do the following:
|
| 86 |
|
| 87 | ```bash
|
| 88 | npm test
|
| 89 | ```
|
| 90 |
|
| 91 | To do some in-browser testing do:
|
| 92 |
|
| 93 | ```bash
|
| 94 | npm start
|
| 95 | ```
|
| 96 |
|
| 97 | and navigate to `http://localhost:8090/test/`
|
| 98 |
|
| 99 | To build the library do:
|
| 100 |
|
| 101 | ```bash
|
| 102 | npm run build
|
| 103 | ```
|
| 104 |
|
| 105 | The output is written to `dist/geotiff.browserify.js` and `dist/geotiff.browserify.min.js`.
|
| 106 |
|
| 107 | ## Usage
|
| 108 |
|
| 109 | geotiff.js works with both `require` and the global variable `GeoTIFF`:
|
| 110 |
|
| 111 | ```javascript
|
| 112 | const GeoTIFF = require('geotiff');
|
| 113 | // or
|
| 114 | import GeoTIFF from 'geotiff';
|
| 115 | ```
|
| 116 |
|
| 117 | or:
|
| 118 |
|
| 119 | ```html
|
| 120 | <script src="dist/geotiff.bundle.js"></script>
|
| 121 | <!-- or use the minified version:
|
| 122 | <script src="dist/geotiff.bundle.min.js"></script>
|
| 123 | -->
|
| 124 | <script>
|
| 125 | console.log(GeoTIFF);
|
| 126 | </script>
|
| 127 | ```
|
| 128 |
|
| 129 | To parse a GeoTIFF, first a data source is required. To help with the development,
|
| 130 | there are shortcuts available. The following creates a source that reads from a
|
| 131 | remote GeoTIFF referenced by a URL:
|
| 132 |
|
| 133 | ```javascript
|
| 134 | GeoTIFF.fromUrl(someUrl)
|
| 135 | .then(tiff => { /* ... */});
|
| 136 |
|
| 137 | // or when using async/await
|
| 138 | (async function() {
|
| 139 | const tiff = await GeoTIFF.fromUrl(someUrl);
|
| 140 | // ...
|
| 141 | })()
|
| 142 | ```
|
| 143 |
|
| 144 | Note: the interactions with geotiff.js objects are oftentimes asynchronous. For
|
| 145 | the sake of brevity we will only show the async/await syntax and not the
|
| 146 | `Promise` based one in the following examples.
|
| 147 |
|
| 148 | Accessing remote images is just one way to open TIFF images with geotiff.js. Other
|
| 149 | options are reading from a local `ArrayBuffer`:
|
| 150 |
|
| 151 | ```javascript
|
| 152 | // using local ArrayBuffer
|
| 153 | const response = await fetch(someUrl);
|
| 154 | const arrayBuffer = await response.arrayBuffer();
|
| 155 | const tiff = await GeoTIFF.fromArrayBuffer(arrayBuffer);
|
| 156 | ```
|
| 157 |
|
| 158 | or a `Blob`/`File`:
|
| 159 |
|
| 160 | ```html
|
| 161 | <input type="file" id="file">
|
| 162 | <script>
|
| 163 | const input = document.getElementById('file'):
|
| 164 | input.onchange = async function() {
|
| 165 | const tiff = await GeoTIFF.fromBlob(input.files[0]);
|
| 166 | }
|
| 167 | </script>
|
| 168 | ```
|
| 169 |
|
| 170 | Now that we have opened the TIFF file, we can inspect it. The TIFF is structured
|
| 171 | in a small header and a list of one or more images (Image File Directory, IFD to
|
| 172 | use the TIFF nomenclature). To get one image by index the `getImage()` function
|
| 173 | must be used. This is again an asynchronous operation, as the IFDs are loaded
|
| 174 | lazily:
|
| 175 |
|
| 176 | ```javascript
|
| 177 | const image = await tiff.getImage(); // by default, the first image is read.
|
| 178 | ```
|
| 179 |
|
| 180 | Now that we have obtained a `GeoTIFFImage` object we can inspect its metadata
|
| 181 | (like size, tiling, number of samples, geographical information, etc.). All
|
| 182 | the metadata is parsed once the IFD is first parsed, thus the access to that
|
| 183 | is synchronous:
|
| 184 |
|
| 185 | ```javascript
|
| 186 | const width = image.getWidth();
|
| 187 | const height = image.getHeight();
|
| 188 | const tileWidth = image.getTileWidth();
|
| 189 | const tileHeight = image.getTileHeight();
|
| 190 | const samplesPerPixel = image.getSamplesPerPixel();
|
| 191 |
|
| 192 | // when we are actually dealing with geo-data the following methods return
|
| 193 | // meaningful results:
|
| 194 | const origin = image.getOrigin();
|
| 195 | const resolution = image.getResolution();
|
| 196 | const bbox = image.getBoundingBox();
|
| 197 | ```
|
| 198 |
|
| 199 | The actual raster data is not fetched and parsed automatically. This is because
|
| 200 | it is usually much more spacious and the decoding of the pixels can be time
|
| 201 | consuming due to the necessity of decompression.
|
| 202 |
|
| 203 | To read a whole image into one big array of arrays the following method call can be used:
|
| 204 |
|
| 205 | ```javascript
|
| 206 | const data = await image.readRasters();
|
| 207 | ```
|
| 208 |
|
| 209 | For convenience the result always has a `width` and `height` attribute:
|
| 210 |
|
| 211 | ```javascript
|
| 212 | const data = await image.readRasters();
|
| 213 | const { width, height } = data;
|
| 214 | ```
|
| 215 |
|
| 216 | By default, the raster is split to a separate array for each component. For an RGB image
|
| 217 | for example, we'd get three arrays, one for red, green and blue.
|
| 218 |
|
| 219 | ```javascript
|
| 220 | const [red, green, blue] = await image.readRasters();
|
| 221 | ```
|
| 222 |
|
| 223 | If we want instead all the bands interleaved in one big array, we have to pass the
|
| 224 | `interleave: true` option:
|
| 225 |
|
| 226 | ```javascript
|
| 227 | const [r0, g0, b0, r1, g1, b1, ...] = await image.readRasters({ interleave: true });
|
| 228 | ```
|
| 229 |
|
| 230 | If we are only interested in a specific region of the image, the `window` option can be
|
| 231 | used to limit reading in that bounding box. Note: the bounding box is in 'image coordinates'
|
| 232 | not geographical ones:
|
| 233 |
|
| 234 | ```javascript
|
| 235 | const left = 50;
|
| 236 | const top = 10;
|
| 237 | const right = 150;
|
| 238 | const bottom = 60;
|
| 239 |
|
| 240 | const data = await image.readRasters({ window: [left, top, right, bottom] });
|
| 241 | ```
|
| 242 |
|
| 243 | This image window can go beyond the image bounds. In that case it might be usefull to supply
|
| 244 | a `fillValue: value` option (can also be an array, one value for each sample).
|
| 245 |
|
| 246 | It is also possible to just read specific samples for each pixel. For example, we can only
|
| 247 | read the red component from an RGB image:
|
| 248 |
|
| 249 | ```javascript
|
| 250 | const [red] = await image.readRasters({ samples: [0] });
|
| 251 | ```
|
| 252 |
|
| 253 | When you want your output in a specific size, you can use the `width` and `height` options.
|
| 254 | This defaults of course to the size of your supplied `window` or the image size if no
|
| 255 | `window` was supplied.
|
| 256 |
|
| 257 | As the data now needs to be resampled, a `resampleMethod` can be specified. This defaults to
|
| 258 | the nearest neighbour method, but also the `'bilinear'` method is supported:
|
| 259 |
|
| 260 | ```javascript
|
| 261 | const data = await image.readRasters({ width: 40, height: 40, resampleMethod: 'bilinear' });
|
| 262 | ```
|
| 263 |
|
| 264 | ### Using decoder pools to improve parsing performance
|
| 265 |
|
| 266 | Decoding compressed images can be a time consuming process. To minimize this
|
| 267 | geotiff.js provides the `Pool` mechanism which uses WebWorkers to split the amount
|
| 268 | of work on multiple 'threads'.
|
| 269 |
|
| 270 | ```javascript
|
| 271 | const pool = new GeoTIFF.Pool();
|
| 272 | const data = await image.readRasters({ pool });
|
| 273 | ```
|
| 274 |
|
| 275 | It is possible to provide a pool size (i.e: number of workers), by default the number
|
| 276 | of available processors is used.
|
| 277 |
|
| 278 | Because of the way WebWorker work (pun intended), there is a considerable overhead
|
| 279 | involved when using the `Pool`, as all the data must be copied and cannot be simply be
|
| 280 | shared. But the benefits are two-fold. First: for larger image reads the overall time
|
| 281 | is still likely to be reduced and second: the main thread is relieved which helps to
|
| 282 | uphold responsiveness.
|
| 283 |
|
| 284 | Note: WebWorkers are only available in browsers. For node applications this feature
|
| 285 | is not available out of the box.
|
| 286 |
|
| 287 | ### Dealing with visual data
|
| 288 |
|
| 289 | The TIFF specification provides various ways to encode visual data. In the
|
| 290 | specification this is called photometric interpretation. The simplest case we
|
| 291 | already dealt with is the RGB one. Others are grayscale, paletted images, CMYK,
|
| 292 | YCbCr, and CIE L*a*b.
|
| 293 |
|
| 294 | geotiff.js provides a method to automatically convert these images to RGB:
|
| 295 | `readRGB()`. This method is very similar to the `readRasters` method with
|
| 296 | distinction that the `interleave` option is now always `true` and the
|
| 297 | `samples` are automatically chosen.
|
| 298 |
|
| 299 | ```javascript
|
| 300 | const rgb = await image.readRGB({
|
| 301 | // options...
|
| 302 | });
|
| 303 | ```
|
| 304 |
|
| 305 | ### Automatic image selection (experimental)
|
| 306 |
|
| 307 | When dealing with images that have internal (or even external, see the next section)
|
| 308 | overviews, `GeoTIFF` objects provide a separate `readRasters` method. This method
|
| 309 | works very similar to the method on the `GeoTIFFImage` objects with the same name.
|
| 310 | By default, it uses the larges image available (highest resolution), but when either
|
| 311 | `width`, `height`, `resX`, or `resY` are specified, then the best fitting image will
|
| 312 | be used for reading.
|
| 313 |
|
| 314 | Additionally, it allows the `bbox` instead of the `window` parameter. This works
|
| 315 | similarly, but uses geographic coordinates instead of pixel ones.
|
| 316 |
|
| 317 | ```javascript
|
| 318 | const data = await tiff.readRasters({
|
| 319 | bbox: [10.34, 57.28, 13.34, 60.23],
|
| 320 | resX: 0.1,
|
| 321 | resY: 0.1
|
| 322 | });
|
| 323 | ```
|
| 324 |
|
| 325 | ### External overviews
|
| 326 |
|
| 327 | Especially for certain kinds of high resolution images it is not uncommon to separate
|
| 328 | the highest resolution from the lower resolution overviews (usually using the `.ovr`
|
| 329 | extension). With geotiff.js it is possible to use files of this setup, just as you
|
| 330 | would use single-file images by taking advantage of the `MultiGeoTIFF` objects. They
|
| 331 | behave exactly the same as the before mentioned `GeoTIFF` objects: you can select
|
| 332 | images by index or read data using `readRasters`. Toget such a file use the `fromUrls`
|
| 333 | factory function:
|
| 334 |
|
| 335 | ```javascript
|
| 336 | const multiTiff = await GeoTIFF.fromUrls(
|
| 337 | 'LC08_L1TP_189027_20170403_20170414_01_T1_B3.TIF',
|
| 338 | ['LC08_L1TP_189027_20170403_20170414_01_T1_B3.TIF.ovr']
|
| 339 | );
|
| 340 | ```
|
| 341 |
|
| 342 | ## What to do with the data?
|
| 343 |
|
| 344 | There is a nice HTML 5/WebGL based rendering library called
|
| 345 | [plotty](https://github.com/santilland/plotty), that allows for some really nice
|
| 346 | on the fly rendering of the data contained in a GeoTIFF.
|
| 347 |
|
| 348 | ```html
|
| 349 | <canvas id="plot"></canvas>
|
| 350 | <script>
|
| 351 | // ...
|
| 352 |
|
| 353 | (async function() {
|
| 354 | const tiff = await GeoTIFF.fromUrl(url);
|
| 355 | const image = await tiff.getImage();
|
| 356 | const data = await image.readRasters();
|
| 357 |
|
| 358 | const canvas = document.getElementById("plot");
|
| 359 | const plot = new plotty.plot({
|
| 360 | canvas,
|
| 361 | data: data[0],
|
| 362 | width: image.getWidth(),
|
| 363 | height: image.getHeight(),
|
| 364 | domain: [0, 256],
|
| 365 | colorScale: "viridis"
|
| 366 | });
|
| 367 | plot.render();
|
| 368 | })();
|
| 369 | </script>
|
| 370 | ```
|
| 371 |
|
| 372 | ## BigTIFF support
|
| 373 |
|
| 374 | geotiff.js has a limited support for files in the BigTIFF format. The limitations
|
| 375 | originate in the capabilities of current JavaScript implementations regarding
|
| 376 | 64 bit integer parsers and structures: there are no functions to read 64 bit
|
| 377 | integers from a stream and no such typed arrays. As BigTIFF relies on 64 bit
|
| 378 | offsets and also allows tag values of those types. In order to still provide
|
| 379 | a reasonable support, the following is implemented:
|
| 380 |
|
| 381 | * 64 bit integers are read as two 32 bit integers and then combined. As
|
| 382 | numbers in JavaScript are typically implemented as 64 bit floats, there
|
| 383 | might be inaccuracies for *very* large values.
|
| 384 | * For 64 bit integer arrays, the default `Array` type is used. This might
|
| 385 | cause problems for some compression algorithms if those arrays are used for
|
| 386 | pixel values.
|
| 387 |
|
| 388 | ## Planned stuff:
|
| 389 |
|
| 390 | * Better support of geospatial parameters:
|
| 391 | * Parsing of EPSG identifiers
|
| 392 | * WKT representation
|
| 393 |
|
| 394 | ## Contribution
|
| 395 |
|
| 396 | If you have an idea, found a bug or have a remark, please open a ticket, we will
|
| 397 | look into it ASAP.
|
| 398 |
|
| 399 | Pull requests are welcome as well!
|
| 400 |
|
| 401 | ## Acknowledgements
|
| 402 |
|
| 403 | This library was inspired by
|
| 404 | [GeotiffParser](https://github.com/xlhomme/GeotiffParser.js). It provided a
|
| 405 | great starting point, but lacked the capabilities to read the raw raster data
|
| 406 | which is the aim of geotiff.js.
|