# Chart.js Radial Gauge Chart
Chart.js radial gauge chart implementation
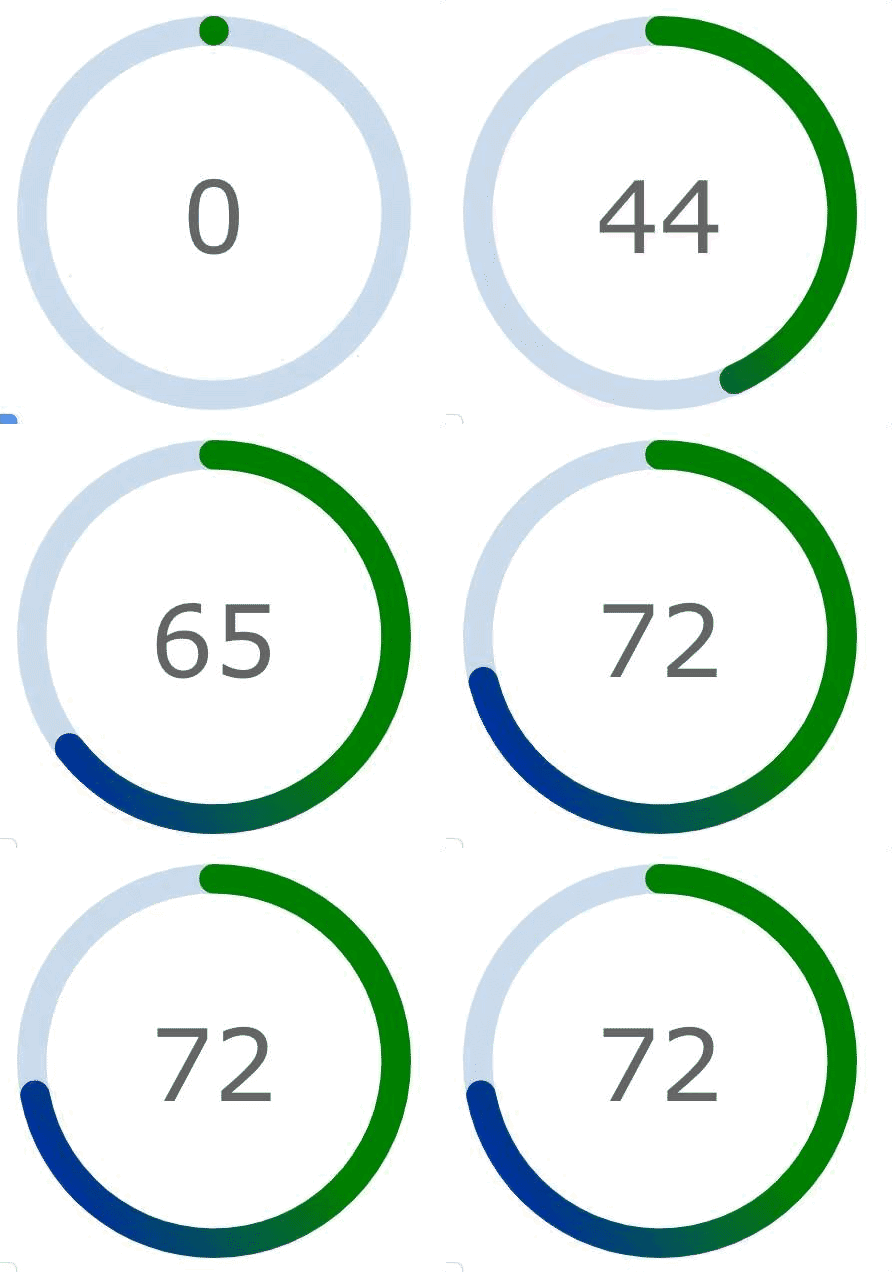 See [Live Samples](https://pandameister.github.io/chartjs-chart-radial-gauge/docs/samples/index.html)
and [Code Pen example](https://codepen.io/pandameister/pen/OrJyYr)
## Install
```bash
npm install --save chart.js chartjs-chart-radial-gauge
```
## Chart Type
The code will register one new chart type with chartjs: `radialGauge`
## Usage
Using node:
```javascript
require('chart.js');
require('chartjs-chart-radial-gauge');
```
Or with a script tag
```html
```
and then use the `radialGauge` chartType when create a Chart:
```javascript
var ctx = document.getElementById('chart-area').getContext('2d');
var config = {
type: 'radialGauge',
options: {
...
},
...
};
new Chart(ctx, config);
```
## Options
Here are the configurable options for the radial gauge and their defaults:
```javascript
options: {
animation: {
// Boolean - Whether we animate the rotation of the radialGauge
animateRotate: true,
// Boolean - Whether we animate scaling the radialGauge from the centre
animateScale: true
},
// The percentage of the chart that is the center area
centerPercentage: 80,
// The rotation for the start of the metric's arc
rotation: -Math.PI / 2,
// the color of the radial gauge's track
trackColor: 'rgb(204, 221, 238)',
// the domain for the data, default is [0, 100]
domain: [0, 365],
// whether arc for the gauge should have rounded corners
roundedCorners: true,
// center value options
centerArea: {
// whether to display the center text value
displayText: true,
// font for the center text
fontFamily: null,
// color of the center text
fontColor: null,
// the size of the center text
fontSize: null,
// padding around the center area
padding: 4,
// an image to use for the center background
backgroundImage: null,
// a color to use for the center background
backgroundColor: null,
// the text to display in the center
// this could be a string or a callback that returns a string
// if a callback is provided it will be called with (value, options)
text: null,
// the text to display beneath the text specified above
subText: null,
}
}
```
## Documentation
See my tutorial on [medium](https://medium.com/@patricepominville/creating-a-new-chart-js-chart-type-5f665d16d7aa)
## Building
```sh
yarn install
yarn build
```
See [Live Samples](https://pandameister.github.io/chartjs-chart-radial-gauge/docs/samples/index.html)
and [Code Pen example](https://codepen.io/pandameister/pen/OrJyYr)
## Install
```bash
npm install --save chart.js chartjs-chart-radial-gauge
```
## Chart Type
The code will register one new chart type with chartjs: `radialGauge`
## Usage
Using node:
```javascript
require('chart.js');
require('chartjs-chart-radial-gauge');
```
Or with a script tag
```html
```
and then use the `radialGauge` chartType when create a Chart:
```javascript
var ctx = document.getElementById('chart-area').getContext('2d');
var config = {
type: 'radialGauge',
options: {
...
},
...
};
new Chart(ctx, config);
```
## Options
Here are the configurable options for the radial gauge and their defaults:
```javascript
options: {
animation: {
// Boolean - Whether we animate the rotation of the radialGauge
animateRotate: true,
// Boolean - Whether we animate scaling the radialGauge from the centre
animateScale: true
},
// The percentage of the chart that is the center area
centerPercentage: 80,
// The rotation for the start of the metric's arc
rotation: -Math.PI / 2,
// the color of the radial gauge's track
trackColor: 'rgb(204, 221, 238)',
// the domain for the data, default is [0, 100]
domain: [0, 365],
// whether arc for the gauge should have rounded corners
roundedCorners: true,
// center value options
centerArea: {
// whether to display the center text value
displayText: true,
// font for the center text
fontFamily: null,
// color of the center text
fontColor: null,
// the size of the center text
fontSize: null,
// padding around the center area
padding: 4,
// an image to use for the center background
backgroundImage: null,
// a color to use for the center background
backgroundColor: null,
// the text to display in the center
// this could be a string or a callback that returns a string
// if a callback is provided it will be called with (value, options)
text: null,
// the text to display beneath the text specified above
subText: null,
}
}
```
## Documentation
See my tutorial on [medium](https://medium.com/@patricepominville/creating-a-new-chart-js-chart-type-5f665d16d7aa)
## Building
```sh
yarn install
yarn build
```