d2recharts
==========
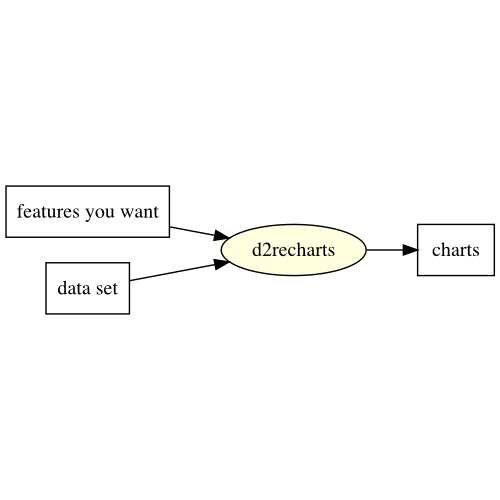
**Data Driven** echarts wrapped as react components.
## what?
## Why?
To make the path from data to chart shorter.
## Install
```shell
npm i d2recharts --save
```
## Usage
A typical use case is like:
```jsx
```
Simplest use case:
```jsx
const data = [
// data goes here
];
```
If you want fully functionality of echarts:
```jsx
const option = {
// echarts option goes here
};
```
## [Demo](./demo)
## [API](./doc/api.md)
## [Roadmap](./doc/roadmap.md)
## [Contributing](./doc/contributing.md)
## Thanks to
* [echarts](https://github.com/ecomfe/echarts): one of the greatest open source project for graphing.
* [echarts-for-react](https://github.com/hustcc/echarts-for-react): where the core react wrapping is stolen from.