# geotiff.js
[](https://travis-ci.org/constantinius/geotiff.js) [](https://www.versioneye.com/user/projects/566af91d4e049b0041000083) [](https://badge.fury.io/js/geotiff)
Read (geospatial) metadata and raw array data from a wide variety of different
(Geo)TIFF files types.
## Features
Currently available functionality:
* Parsing the headers of all possible TIFF files
* Rudimentary extraction of geospatial metadata
* Reading raster data from:
* stripped images
* tiled images
* band interleaved images
* pixel interleaved images
* Supported data-types:
* (U)Int8/16/32
* Float32/64
* Enabled compressions:
* no compression
* Packbits
* LZW
* Deflate
* Subsetting via an image window and selected bands
* Reading of samples into separate arrays or a single pixel-interleaved array
* Configurable tile/strip cache
* Limited [bigTIFF](http://bigtiff.org/#FILE_FORMAT) support
* Automated testing via PhantomJS
Further documentation can be found [here](http://constantinius.github.io/geotiff.js/).
## Example Usage
* [Slice view using Cesium.js (TAMP project)](http://www.youtube.com/watch?v=E6kFLtKgeJ8)
[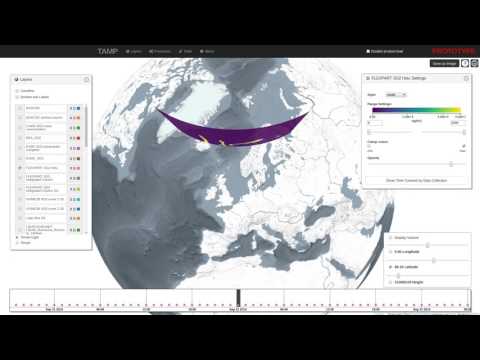](http://www.youtube.com/watch?v=E6kFLtKgeJ8)
* [Contour generation using d3-contour](https://bl.ocks.org/mbostock/83c0be21dba7602ee14982b020b12f51)
[](https://bl.ocks.org/mbostock/83c0be21dba7602ee14982b020b12f51)
## Setup
To setup the repository do the following steps:
```bash
# clone repo
git clone https://github.com/constantinius/geotiff.js.git
cd geotiff.js/
# install development dependencies
npm install -g grunt-cli
npm install
```
## Testing and Building
In order to run the tests you first have to set up the test data. This requires
the [GDAL](http://gdal.org/) and [ImageMagick](http://imagemagick.org/) tools.
Installation of these tools varies according to the operating system, the
following listing shows the installation on Ubuntu (using the ubuntugis-unstable
repository):
```bash
sudo add-apt-repository -y ppa:ubuntugis/ubuntugis-unstable
sudo apt-get update
sudo apt-get install -y gdal-bin imagemagick
```
When GDAL and ImageMagick is installed, the test data setup script can be run:
```bash
cd test/data
sh setup_data.sh
cd -
```
To test the library (using PhantomJS, karma, mocha and chai) do the following:
```bash
npm test
```
To do some in-browser testing do:
```bash
npm start
```
and navigate to `http://localhost:9000/test/`
To build the library do:
```bash
npm run build
```
The output is written to `dist/geotiff.browserify.js` and `dist/geotiff.browserify.min.js`.
## Usage
geotiff.js works with both browserify style `require` and the global variable
`GeoTIFF`:
```javascript
var GeoTIFF = require("geotiff");
```
or:
```html
```
To actually open a GeoTIFF image use the `parse` function. It works with both
`ArrayBuffer` and `String`:
```javascript
var xhr = new XMLHttpRequest();
xhr.open('GET', url, true);
xhr.responseType = 'arraybuffer';
xhr.onload = function(e) {
var tiff = GeoTIFF.parse(this.response);
// ...
}
xhr.send();
```
Similarly, the `fetch()` API can be used:
```javascript
fetch(url)
.then(function(response) { return response.arrayBuffer(); })
.then(function(data) {
const tiff = GeoTIFF.parse(data);
// ...
});
```
When using the parser in node, you have to convert the `Buffer` to an
`ArrayBuffer` first. See the following example for the conversion:
```javascript
var GeoTIFF = require("geotiff");
var fs = require("fs");
fs.readFile(path, function(err, data) {
if (err) throw err;
dataArray = data.buffer.slice(data.byteOffset, data.byteOffset + data.byteLength);
var tiff = GeoTIFF.parse(dataArray);
// ...
});
```
Each TIFF file can be comprised of multiple "subfiles", containing the actual
raster data. To get the actual images, use the `getImage` method:
```javascript
var image = tiff.getImage(); // or use .getImage(n) where n is between 0 and
// tiff.getImageCount()
console.log(image.getWidth(), image.getHeight(), image.getSamplesPerPixel());
```
To actually read raster data the `readRasters` method does the job. It returns
an `Array` of `TypedArrays` for each of the requested samples of the requested
region:
```javascript
var rasterWindow = [50, 50, 100, 100]; // left, top, right, bottom
var samples = [0, 1, 2, 3];
var rasters = image.readRasters({window: rasterWindow, samples: samples});
for (var i = 0; i < rasters.length; ++i) {
console.log(rasters[i]);
}
// to read all samples with no subsets:
rasters = image.readRasters();
// to read the data in a single interleaved array:
var array = image.readRasters({interleave: true});
```
To read TIFF or geo-spatial metadata, the methods `.getFileDirectory()` and
`.getGeoKeys()` provide the data:
```javascript
console.log(image.getFileDirectory(), image.getGeoKeys());
```
## What to do with the data?
There is a nice HTML 5/WebGL based rendering library called
[plotty](https://github.com/santilland/plotty), that allows for some really nice
on the fly rendering of the data contained in a GeoTIFF.
```html
```
## RGB-data
When the TIFF file has color data stored, this can automatically extracted
using the `readRGB` method. This always resolves with an `Uint8Array` with
interleaved red, green, and blue values.
This method translates CMYK and YCbCr colorspaces to RGB, supports
color maps and two versions of grey-scale images (black is zero/white is zero).
The following example shows how to display such data in a browsers canvas:
var parser = GeoTIFF.parse(data);
var image = parser.getImage();
image.readRGB(function(raster) {
var canvas = document.getElementById('canvas');
canvas.width = image.getWidth();
canvas.height = image.getHeight();
var ctx = canvas.getContext("2d");
var imageData = ctx.createImageData(image.getWidth(), image.getHeight());
var data = imageData.data;
var o = 0;
for (var i = 0; i < raster.length; i+=3) {
data[o] = raster[i];
data[o+1] = raster[i+1];
data[o+2] = raster[i+2];
data[o+3] = 255;
o += 4;
}
ctx.putImageData(imageData, 0, 0);
});
## BigTIFF support
geotiff.js has a limited support for files in the BigTIFF format. The limitations
originate in the capabilities of current JavaScript implementations regarding
64 bit integer parsers and structures: there are no functions to read 64 bit
integers from a stream and no such typed arrays. As BigTIFF relies on 64 bit
offsets and also allows tag values of those types. In order to still provide
a reasonable support, the following is implemented:
* 64 bit integers are read as two 32 bit integers and then combined. As
numbers in JavaScript are typically implemented as 64 bit floats, there
might be inaccuracies for *very* large values.
* For 64 bit integer arrays, the default `Array` type is used. This might
cause problems for some compression algorithms if those arrays are used for
pixel values.
## Planned stuff:
* Better support of geospatial parameters:
* Parsing of EPSG identifiers
* WKT representation
* Specifying of window in CRS coordinates
* Improving support of CIEL*a*b* images
* Support of "overview images" (i.e: images with reduced resolution)
## Contribution
If you have an idea, found a bug or have a remark, please open a ticket, we will
look into it ASAP.
Pull requests are welcome as well!
## Acknowledgements
This library was inspired by
[GeotiffParser](https://github.com/xlhomme/GeotiffParser.js). It provided a
great starting point, but lacked the capabilities to read the raw raster data
which is the aim of geotiff.js.