# leaflet-geotiff
A [LeafletJS](http://www.leafletjs.com) plugin for displaying geoTIFF raster data. Data can drawn as colored rasters or directon arrows. The layer can be clipped using a polygon.
**[DEMO](https://stuartmatthews.github.io/leaflet-geotiff/)**
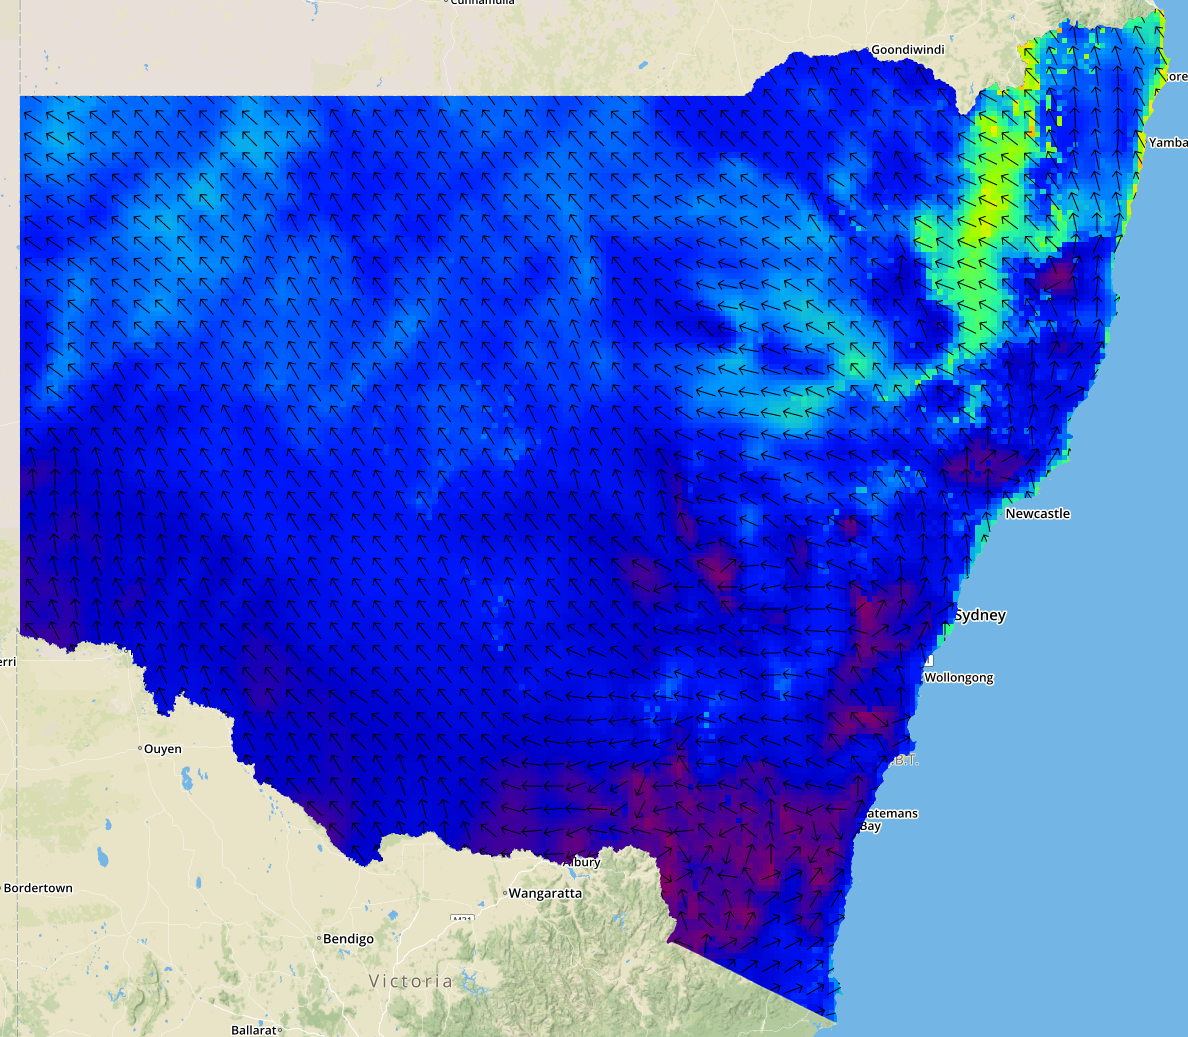
## Instructions
### 1. Include the JavaScript file and dependencies
```html
```
### 2. Add a geoTIFF layer
```
// Create map
var layer = L.leafletGeotiff(url, options).addTo(map);
```
Parameters:
* `url` - GeoTIFF file URL. Currently only EPSG:4326 files are supported.
* `options`:
* `bounds` - (optional) An array specifying the corners of the data, e.g. [[40.712216, -74.22655], [40.773941, -74.12544]]. If omitted the image bounds will be read from the geoTIFF file.
* `band` - (optional, default = 0) geoTIFF band to read.
* `image` - (optional, default = 0) geoTIFF image to read.
* `opacity` - (optional, default = 1) Global opacity value between 0 and 1 (no transparency) that is applied to the GeoTiff.
* `clip` - (optional, default = undefined) Clipping polygon, provided as an array of [lat,lon] coordinates. Note that this is the Leaflet [lat,lon] convention, not geoJSON [lon,lat].
* `renderer` - Renderer to use (see below).
#### Renderer
**Raster data rendered using Plotty**: `L.LeafletGeotiff.plotty(options)`
Options:
- `displayMin` - (optional, default = 0) Minimum values to plot.
- `displayMax` - (optional, default = 1) Maximum values to plot.
- `clampLow`, `clampHigh` - (optional, default = true) If true values outside `displayMin` to `displayMax` will be rendered as if they were valid values.
- `colorScale` - (optional, default = "viridis"). Plotty color scale used to render the image.
New color scales can be created using plotty's `addColorScale` method.
**Vector data rendered as arrows**: `L.LeafletGeotiff.vectorArrows(options)`
Options:
- `arrowSize` - (optional, default = 20) Size in pixels of direction arrows for vector data.
### Advanced usage options
1. Data values can be extracted using the `getValueAtLatLng(lat,lng)` method.
2. Custom renderer can be implemented by extending `L.LeafletGeotiffRenderer`.
## Dependencies
* [Leaflet >= 0.7.7](http://leafletjs.com)
* [geotiff.js](https://github.com/constantinius/geotiff.js)
* [plotty](https://github.com/santilland/plotty) (optional)