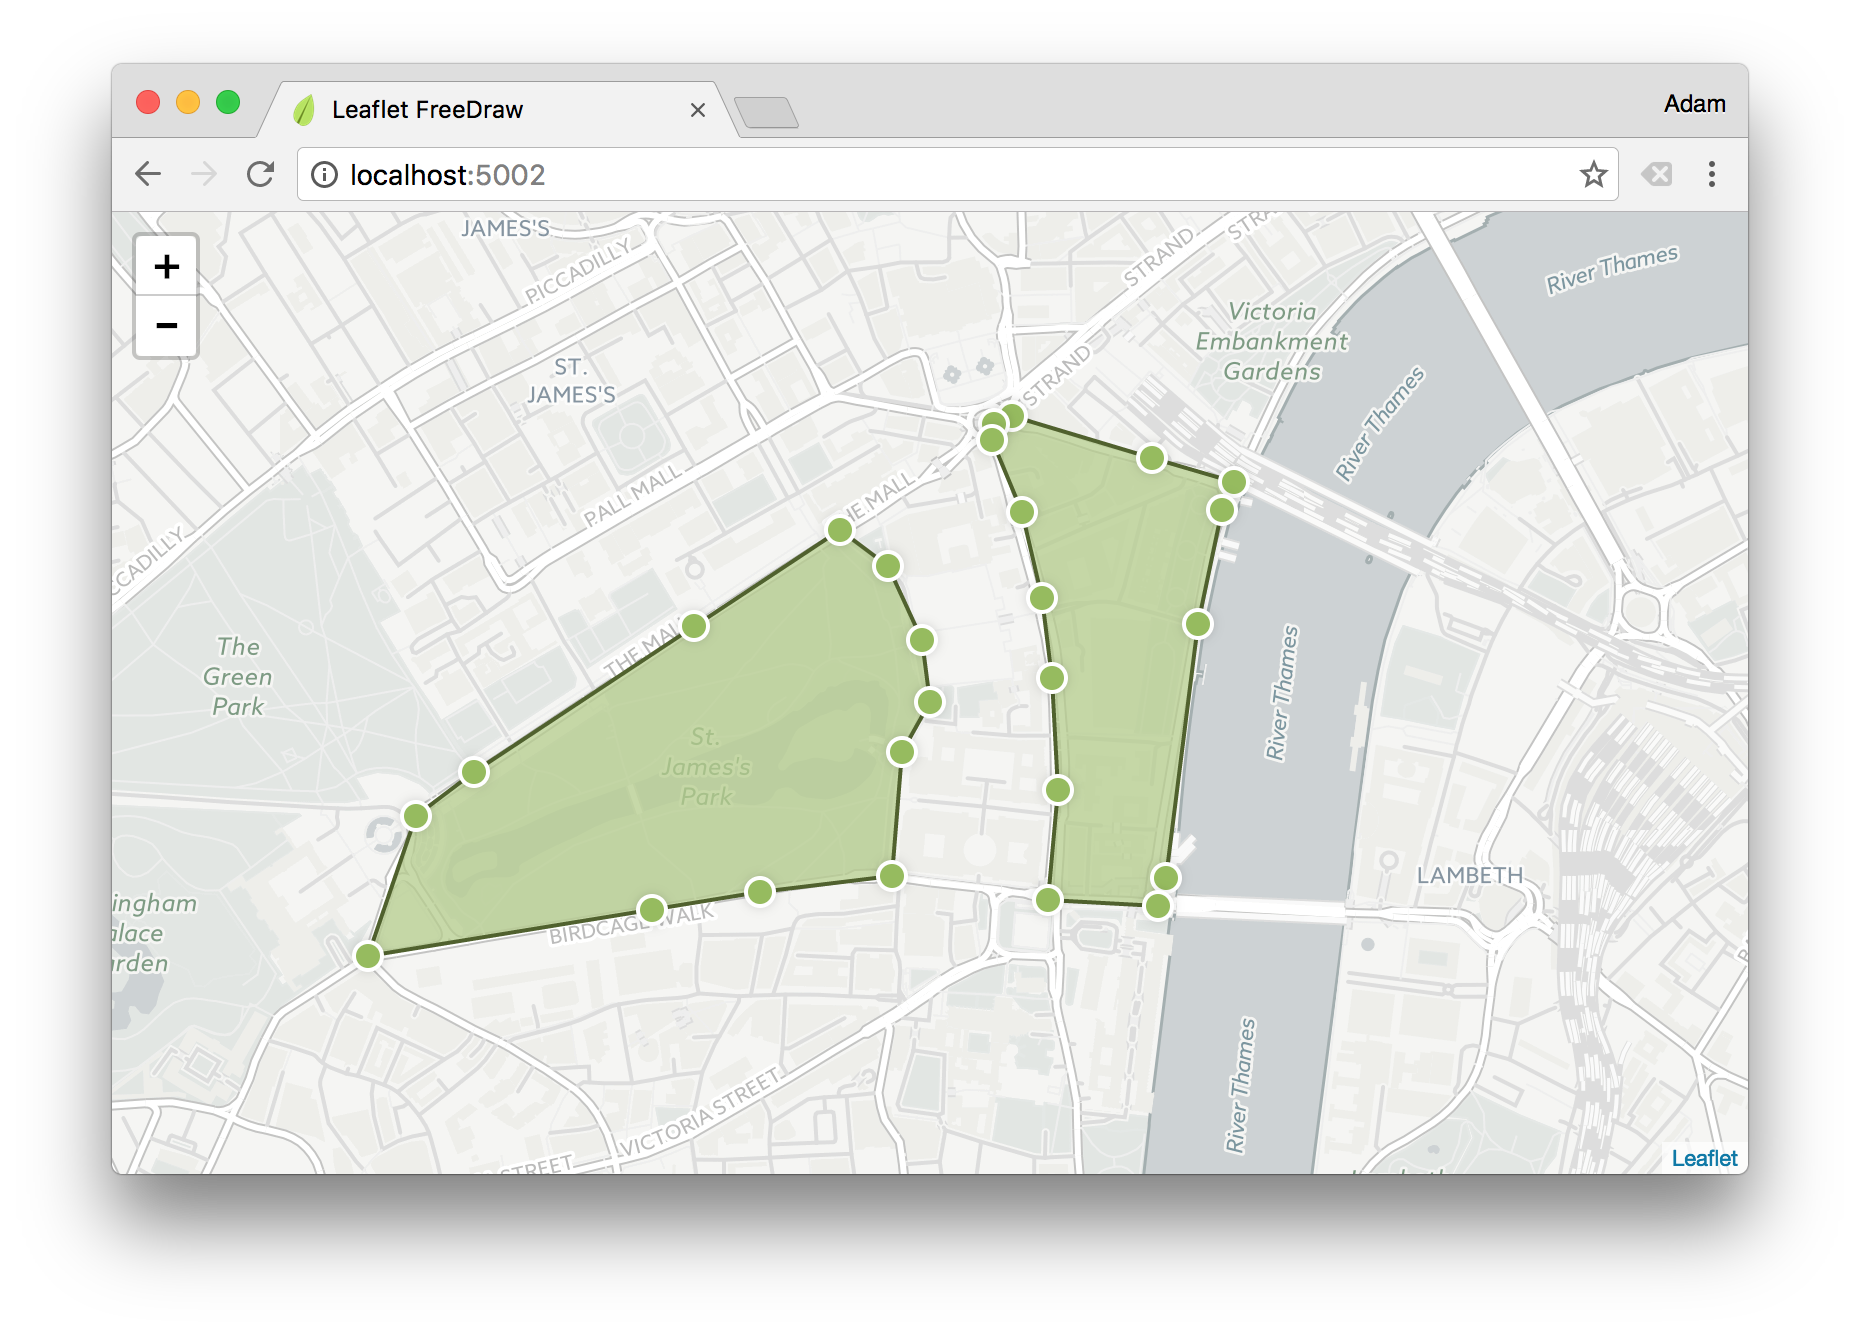
 > FreeDraw allows the free-hand drawing of shapes on your Leaflet.js map layer – providing an intuitive and familiar UX for creating geospatial boundaries similar to [Zoopla](http://www.zoopla.co.uk/for-sale/map/property/london/?include_retirement_homes=true&include_shared_ownership=true&new_homes=include&q=London&results_sort=newest_listings&search_source=home&pn=1&view_type=map) and others. Included out-of-the-box is the [concaving of polygons](http://ubicomp.algoritmi.uminho.pt/local/concavehull.html), polygon merging and simplifying, as well as the ability to add edges and modify existing shapes.
> **Note:** For drawing polylines instead, try [`L.Pather`](https://github.com/Wildhoney/L.Pather).


* **npm:** `npm i leaflet.freedraw`
* **Bower:** `bower i leaflet.freedraw`
* **JSFiddle:** https://jsfiddle.net/t6e48rm5/
## Table of Contents
1. [Browser Support](#browser-support)
2. [Getting Started](#getting-started)
1. [Markers](#markers)
2. [Modes](#modes)
3. [Options](#options)
4. [Classes](#classes)
5. [Methods](#methods)
## Browser Support
> FreeDraw allows the free-hand drawing of shapes on your Leaflet.js map layer – providing an intuitive and familiar UX for creating geospatial boundaries similar to [Zoopla](http://www.zoopla.co.uk/for-sale/map/property/london/?include_retirement_homes=true&include_shared_ownership=true&new_homes=include&q=London&results_sort=newest_listings&search_source=home&pn=1&view_type=map) and others. Included out-of-the-box is the [concaving of polygons](http://ubicomp.algoritmi.uminho.pt/local/concavehull.html), polygon merging and simplifying, as well as the ability to add edges and modify existing shapes.
> **Note:** For drawing polylines instead, try [`L.Pather`](https://github.com/Wildhoney/L.Pather).


* **npm:** `npm i leaflet.freedraw`
* **Bower:** `bower i leaflet.freedraw`
* **JSFiddle:** https://jsfiddle.net/t6e48rm5/
## Table of Contents
1. [Browser Support](#browser-support)
2. [Getting Started](#getting-started)
1. [Markers](#markers)
2. [Modes](#modes)
3. [Options](#options)
4. [Classes](#classes)
5. [Methods](#methods)

## Browser Support


 ## Getting Started
`FreeDraw` functions as a standard Leaflet module, meaning you initialise it and add it to your map layer via the `addLayer` function on your map instance – when you instantiate `FreeDraw` you can pass a set of [`options`](#options) for behaviour customisation.
```javascript
import L from 'leaflet';
import FreeDraw from 'leaflet-freedraw';
const map = new L.Map(node);
const freeDraw = new FreeDraw();
map.addLayer(freeDraw);
```
By attaching `FreeDraw` to your map layer, an SVG node will be appended to the DOM, and mouse event listeners will be attached to the `map` instance for creating and managing the geospatial polygons.
**Note:** If you're using Webpack to run/build your project, don't forget to add those few lines to your config:
```javascript
resolve: {
alias: {
L: 'leaflet',
ClipperLib: 'clipper-lib',
R: 'ramda'
}
},
```
### Markers
When a user creates a polygon an event is fired on the `map` instance called `markers` which you can listen for by using the native Leaflet `on` function.
```javascript
freeDraw.on('markers', event => {
console.log(event.latLngs);
});
```
Once you have received the latitude and longitude values the next step would likely be to perform any necessary geospatial queries, and then render the relevant markers onto the map – for this you *could* use `L.Marker` and the native `addTo` method for [placing markers](http://leafletjs.com/reference-1.0.2.html#marker) on the map – however the important take-away is that `FreeDraw` doesn't concern itself with marker placement, as this is sufficiently covered by Leaflet.
### Modes
By default the mode is `ALL` which means all actions can be performed on the `FreeDraw` layer — create, edit, delete, and append — you're able to modify the mode at any time by using the `mode` method, or upon instantiation by passing an object as the first argument.
```javascript
import L from 'leaflet';
import FreeDraw, { CREATE, EDIT } from 'leaflet-freedraw';
const map = new L.Map(node);
const freeDraw = new FreeDraw({
mode: CREATE | EDIT
});
```
By passing in the `mode` as `CREATE | EDIT` you're **only** allowing the user to create and edit polygons, they are not able to append edges, nor delete them. You may use the `mode` method post-instantiation to modify the `mode` at any time – in the case below to also allow deleting of polygons.
```javascript
// Allow create, edit and delete.
freeDraw.mode(CREATE | EDIT | DELETE);
// Allow everything except create.
freeDraw.mode(ALL ^ CREATE);
// Allow nothing.
freeDraw.mode(NONE);
```
> Note: Invoking `mode` without passing a mode simply returns the current mode.
### Options
All of the following options can be passed in when instantiating `FreeDraw` in the same way that we pass `mode` in the previous examples.
| Option | Default | Result |
| ---------------------- |------------- | ------------------------------------ |
| `mode` | `ALL` | Modifies the default [mode](#modes). |
| `smoothFactor` | `0.3` | By how much to [smooth](http://leafletjs.com/reference-1.0.2.html#polyline-smoothfactor) the polygons. |
| `elbowDistance` | `10` | Factor to determine when to delete or when to append an edge. |
| `simplifyFactor` | `1.1` | By how much to [simplify](https://sourceforge.net/p/jsclipper/wiki/documentation/#clipperlibclippercleanpolygon) the polygon. |
| `mergePolygons` | `true` | Whether to attempt merging of polygons that intersect. |
| `concavePolygon` | `true` | Whether to apply the [concaving algorithm](http://ubicomp.algoritmi.uminho.pt/local/concavehull.html) to the polygons. |
| `maximumPolygons` | `Infinity` | Maximum number of polygons to be added to the map layer. |
| `recreateAfterEdit` | `false` | Whether to recreate the polygons subsequent to them being modified. |
| `notifyAfterEditExit` | `false` | Whether to defer `markers` event until after exiting `EDIT` mode. |
| `leaveModeAfterCreate` | `false` | Whether to exit `CREATE` mode after each polygon creation. |
By using the options above we can tweak how `FreeDraw` functions – whilst some of the options have obvious effects, others are much more *tweak and see* based on your expected outcome – such as the subjective `simplifyFactor` and `elbowDistance` options.
### Classes
Depending on the current modes active on the map instance, the relevant classes are applied to the `map` container that you instantiated `L.Map` with – by using these class names it allows you to tailor the UX to the current mode, such as changing the `cursor` to `crosshair` when the user is allowed to create polygons.
| Class Name | Mode |
| ------------------- |------------- |
| `mode-none` | `NONE` |
| `mode-create` | `CREATE` |
| `mode-edit` | `EDIT` |
| `mode-delete` | `DELETE` |
| `mode-append` | `APPEND` |
```css
.map.mode-create {
cursor: crosshair;
}
```
From the above example if the current mode is `CREATE | EDIT | APPEND` then the **three** class names that will be present on the `map` node will be `mode-create`, `mode-edit` and `mode-append`, allowing you to provide a better UX from within your attached stylesheet.
### Methods
With the instance of `freeDraw` there are certain methods for manipulating `FreeDraw` directly, such as creating polygon from a set of latitude and longitude values.
| Method | Yields | Result |
| ------------------- |------------- | -------------------------------------------------------------- |
| `create` | `Array` | Creates a polygon by passing an array of `LatLng`s |
| `remove` | `void` | Removes a polygon that is yielded from `create` |
| `clear` | `void` | Clears all polygons from the current instance |
| `mode` | `Number` | Sets and retrieves the current [`mode`](#modes). |
| `cancel` | `void` | Cancels the current create action – such as on escape. |
| `size` | `Number` | Yields the number of polygons on the map layer. |
| `all` | `Array` | Enumerate all of the current polygons for the current layer |
When using the `create` method to create polygons from an array of latitude and longitude values, the `CREATE` mode is disregarded, which means it doesn't need to be enabled to `create` to succeed – if you would like such behaviour then you could simply assert that `CREATE` is enabled.
```javascript
import L, { LatLng } from 'leaflet';
import FreeDraw from 'leaflet-freedraw';
const map = new L.Map(node);
const freeDraw = new FreeDraw();
// Create a polygon based on the given lat/long values.
const polygons = freeDraw.create([
new LatLng(51.50046151184328, -0.08771896362304689),
new LatLng(51.50067523261736, -0.09175300598144533),
new LatLng(51.50329323076107, -0.09106636047363283),
new LatLng(51.50409462869737, -0.08763313293457033)
]);
// Remove the created polygons from the map.
polygons.forEach(polygon => freeDraw.remove(polygon));
// Alternatively you could have cleared ALL polygons.
freeDraw.clear();
```
**Note:** `create` method returns an array of polygons, as often it may yield more than one.
In the case of the `cancel` method it's often desirable to cancel the creation of the polygon when the escape key is pressed – for this you simply need to attach an event to the `document.body`.
```javascript
document.addEventListener('keydown', event => {
// Cancel the current action when the escape key is pressed.
event.key === 'Escape' && freeDraw.cancel();
});
```
## Getting Started
`FreeDraw` functions as a standard Leaflet module, meaning you initialise it and add it to your map layer via the `addLayer` function on your map instance – when you instantiate `FreeDraw` you can pass a set of [`options`](#options) for behaviour customisation.
```javascript
import L from 'leaflet';
import FreeDraw from 'leaflet-freedraw';
const map = new L.Map(node);
const freeDraw = new FreeDraw();
map.addLayer(freeDraw);
```
By attaching `FreeDraw` to your map layer, an SVG node will be appended to the DOM, and mouse event listeners will be attached to the `map` instance for creating and managing the geospatial polygons.
**Note:** If you're using Webpack to run/build your project, don't forget to add those few lines to your config:
```javascript
resolve: {
alias: {
L: 'leaflet',
ClipperLib: 'clipper-lib',
R: 'ramda'
}
},
```
### Markers
When a user creates a polygon an event is fired on the `map` instance called `markers` which you can listen for by using the native Leaflet `on` function.
```javascript
freeDraw.on('markers', event => {
console.log(event.latLngs);
});
```
Once you have received the latitude and longitude values the next step would likely be to perform any necessary geospatial queries, and then render the relevant markers onto the map – for this you *could* use `L.Marker` and the native `addTo` method for [placing markers](http://leafletjs.com/reference-1.0.2.html#marker) on the map – however the important take-away is that `FreeDraw` doesn't concern itself with marker placement, as this is sufficiently covered by Leaflet.
### Modes
By default the mode is `ALL` which means all actions can be performed on the `FreeDraw` layer — create, edit, delete, and append — you're able to modify the mode at any time by using the `mode` method, or upon instantiation by passing an object as the first argument.
```javascript
import L from 'leaflet';
import FreeDraw, { CREATE, EDIT } from 'leaflet-freedraw';
const map = new L.Map(node);
const freeDraw = new FreeDraw({
mode: CREATE | EDIT
});
```
By passing in the `mode` as `CREATE | EDIT` you're **only** allowing the user to create and edit polygons, they are not able to append edges, nor delete them. You may use the `mode` method post-instantiation to modify the `mode` at any time – in the case below to also allow deleting of polygons.
```javascript
// Allow create, edit and delete.
freeDraw.mode(CREATE | EDIT | DELETE);
// Allow everything except create.
freeDraw.mode(ALL ^ CREATE);
// Allow nothing.
freeDraw.mode(NONE);
```
> Note: Invoking `mode` without passing a mode simply returns the current mode.
### Options
All of the following options can be passed in when instantiating `FreeDraw` in the same way that we pass `mode` in the previous examples.
| Option | Default | Result |
| ---------------------- |------------- | ------------------------------------ |
| `mode` | `ALL` | Modifies the default [mode](#modes). |
| `smoothFactor` | `0.3` | By how much to [smooth](http://leafletjs.com/reference-1.0.2.html#polyline-smoothfactor) the polygons. |
| `elbowDistance` | `10` | Factor to determine when to delete or when to append an edge. |
| `simplifyFactor` | `1.1` | By how much to [simplify](https://sourceforge.net/p/jsclipper/wiki/documentation/#clipperlibclippercleanpolygon) the polygon. |
| `mergePolygons` | `true` | Whether to attempt merging of polygons that intersect. |
| `concavePolygon` | `true` | Whether to apply the [concaving algorithm](http://ubicomp.algoritmi.uminho.pt/local/concavehull.html) to the polygons. |
| `maximumPolygons` | `Infinity` | Maximum number of polygons to be added to the map layer. |
| `recreateAfterEdit` | `false` | Whether to recreate the polygons subsequent to them being modified. |
| `notifyAfterEditExit` | `false` | Whether to defer `markers` event until after exiting `EDIT` mode. |
| `leaveModeAfterCreate` | `false` | Whether to exit `CREATE` mode after each polygon creation. |
By using the options above we can tweak how `FreeDraw` functions – whilst some of the options have obvious effects, others are much more *tweak and see* based on your expected outcome – such as the subjective `simplifyFactor` and `elbowDistance` options.
### Classes
Depending on the current modes active on the map instance, the relevant classes are applied to the `map` container that you instantiated `L.Map` with – by using these class names it allows you to tailor the UX to the current mode, such as changing the `cursor` to `crosshair` when the user is allowed to create polygons.
| Class Name | Mode |
| ------------------- |------------- |
| `mode-none` | `NONE` |
| `mode-create` | `CREATE` |
| `mode-edit` | `EDIT` |
| `mode-delete` | `DELETE` |
| `mode-append` | `APPEND` |
```css
.map.mode-create {
cursor: crosshair;
}
```
From the above example if the current mode is `CREATE | EDIT | APPEND` then the **three** class names that will be present on the `map` node will be `mode-create`, `mode-edit` and `mode-append`, allowing you to provide a better UX from within your attached stylesheet.
### Methods
With the instance of `freeDraw` there are certain methods for manipulating `FreeDraw` directly, such as creating polygon from a set of latitude and longitude values.
| Method | Yields | Result |
| ------------------- |------------- | -------------------------------------------------------------- |
| `create` | `Array` | Creates a polygon by passing an array of `LatLng`s |
| `remove` | `void` | Removes a polygon that is yielded from `create` |
| `clear` | `void` | Clears all polygons from the current instance |
| `mode` | `Number` | Sets and retrieves the current [`mode`](#modes). |
| `cancel` | `void` | Cancels the current create action – such as on escape. |
| `size` | `Number` | Yields the number of polygons on the map layer. |
| `all` | `Array` | Enumerate all of the current polygons for the current layer |
When using the `create` method to create polygons from an array of latitude and longitude values, the `CREATE` mode is disregarded, which means it doesn't need to be enabled to `create` to succeed – if you would like such behaviour then you could simply assert that `CREATE` is enabled.
```javascript
import L, { LatLng } from 'leaflet';
import FreeDraw from 'leaflet-freedraw';
const map = new L.Map(node);
const freeDraw = new FreeDraw();
// Create a polygon based on the given lat/long values.
const polygons = freeDraw.create([
new LatLng(51.50046151184328, -0.08771896362304689),
new LatLng(51.50067523261736, -0.09175300598144533),
new LatLng(51.50329323076107, -0.09106636047363283),
new LatLng(51.50409462869737, -0.08763313293457033)
]);
// Remove the created polygons from the map.
polygons.forEach(polygon => freeDraw.remove(polygon));
// Alternatively you could have cleared ALL polygons.
freeDraw.clear();
```
**Note:** `create` method returns an array of polygons, as often it may yield more than one.
In the case of the `cancel` method it's often desirable to cancel the creation of the polygon when the escape key is pressed – for this you simply need to attach an event to the `document.body`.
```javascript
document.addEventListener('keydown', event => {
// Cancel the current action when the escape key is pressed.
event.key === 'Escape' && freeDraw.cancel();
});
```