vue-gantt-chart
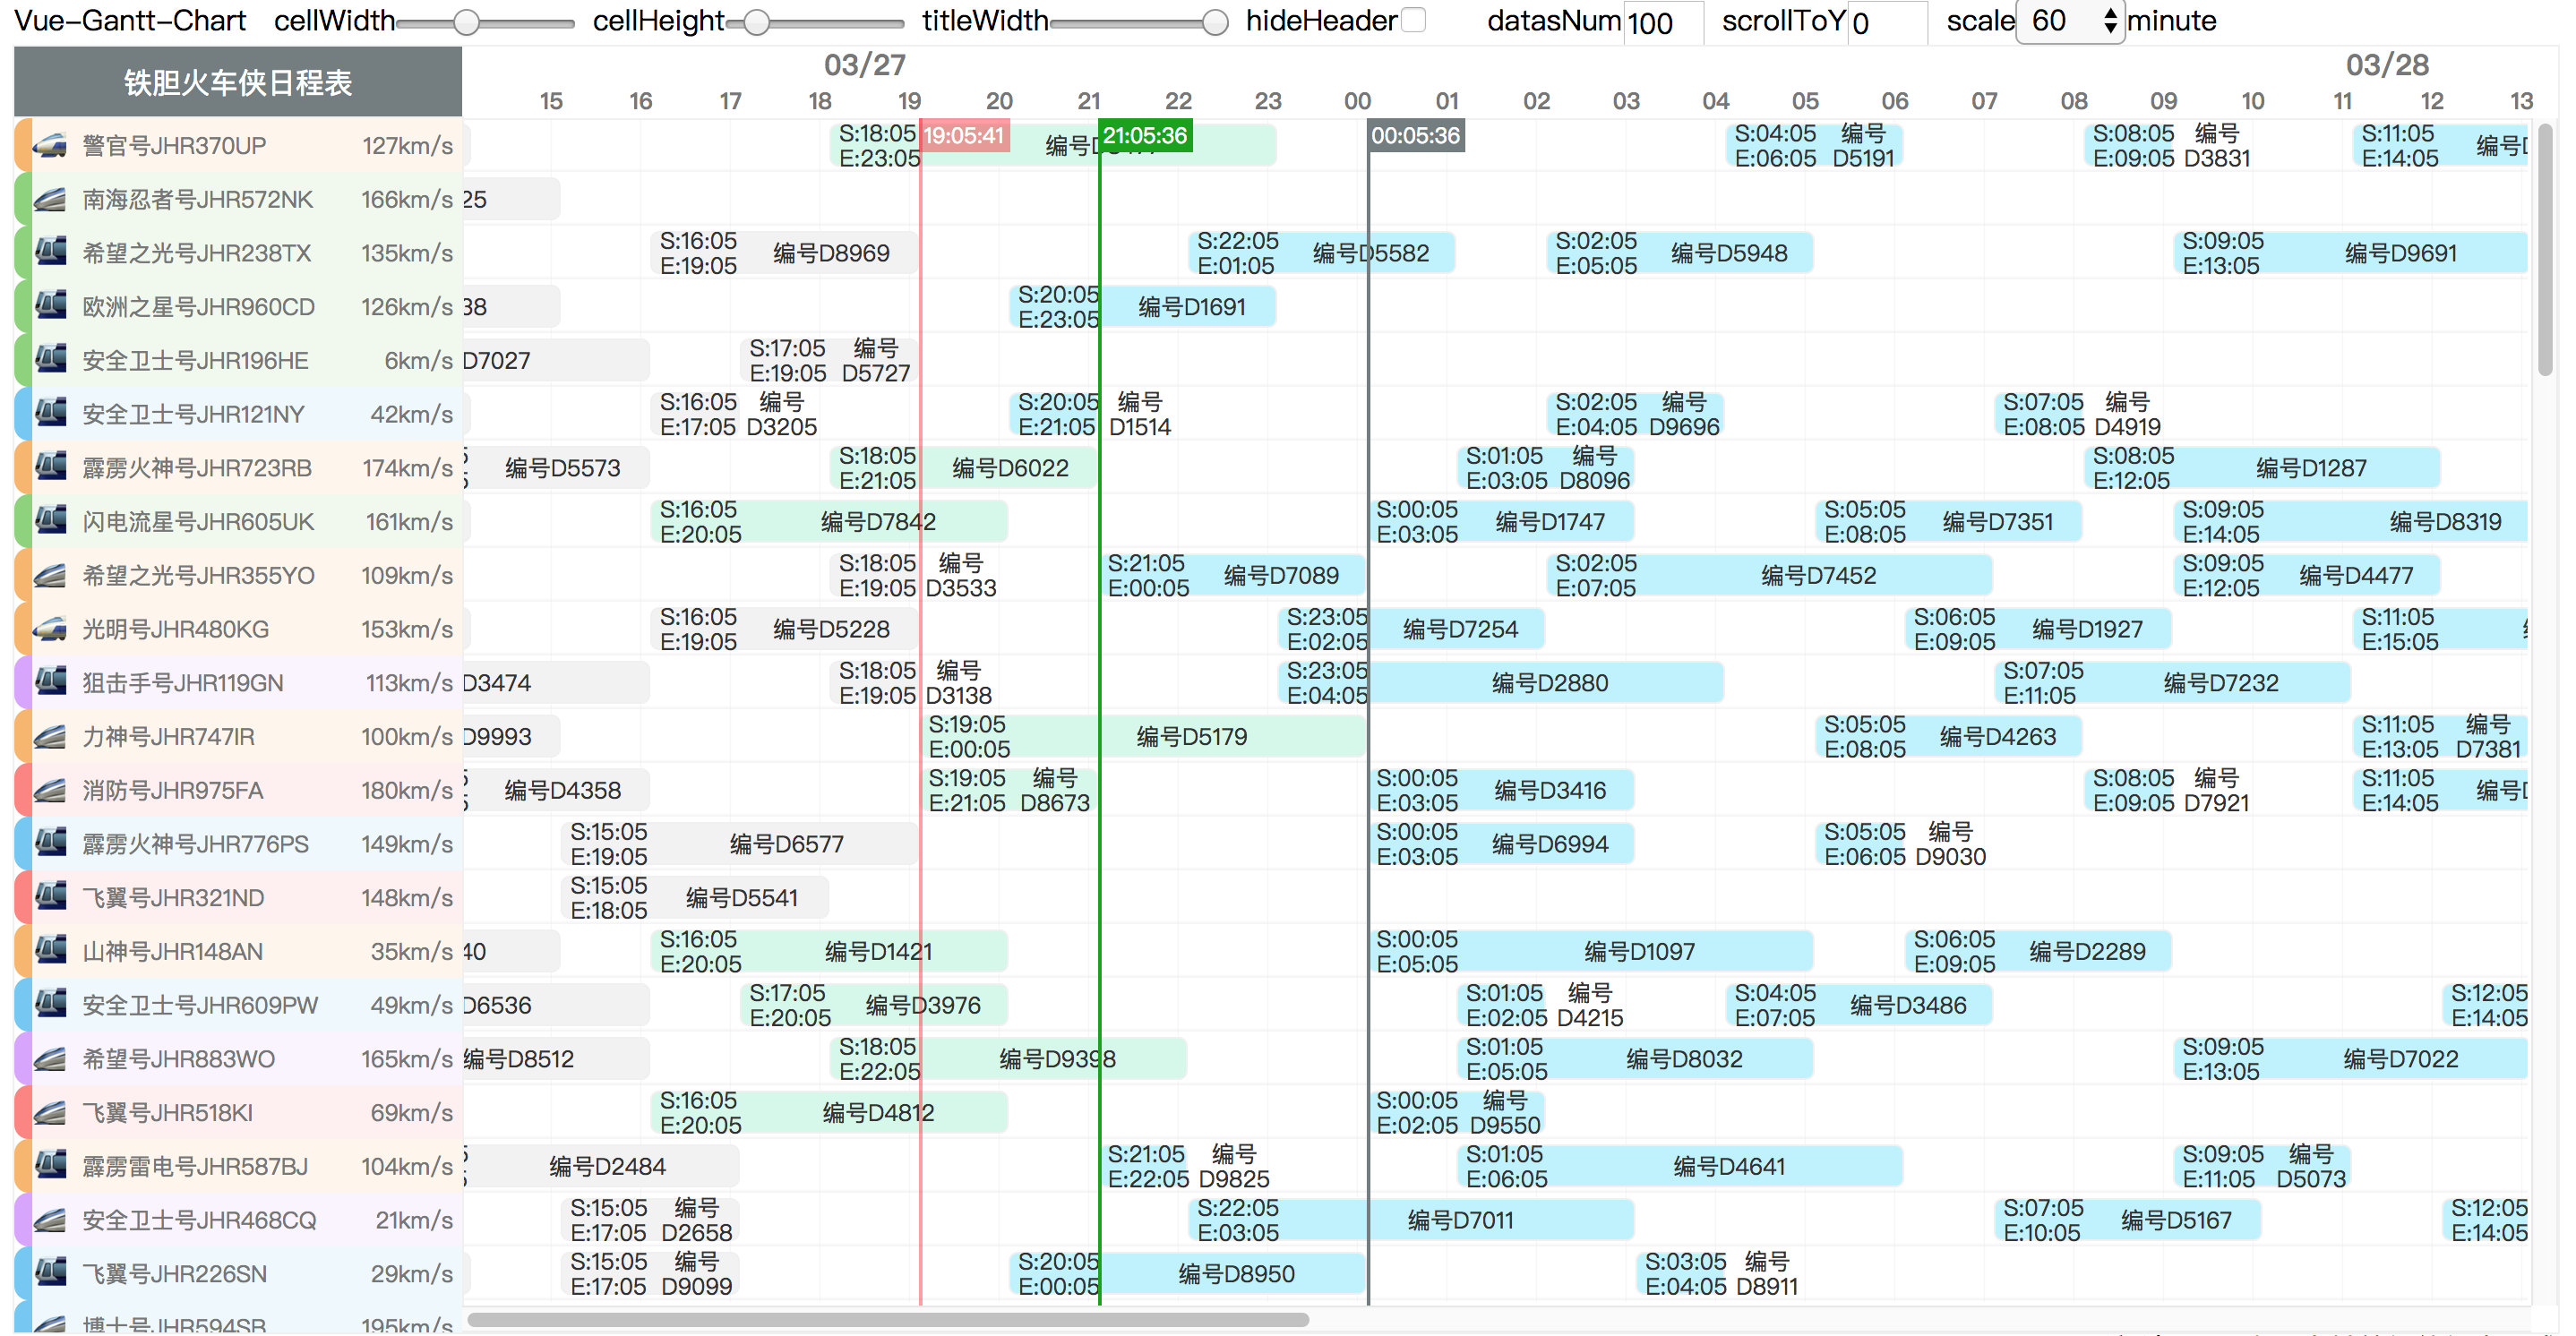
基于 Vue 实现的 gantt-like 图表 ,用于排班展示
[](https://www.npmjs.com/package/v-gantt-chart)
[](https://img.shields.io/npm/dt/v-gantt-chart.svg)

[](http://hits.dwyl.io/w1301625107/Vue-Gantt-chart)
[](https://npmjs.org/package/v-gantt-chart)
## Catalog
- [Feature](#feature)
- [Screenshot](#screenshot)
- [Install](#install)
- [Use](#use)
- [template code](#template-code)
- [script code](#script-code)
- [data](#data)
- [Slot](#slot)
- [block 容器块slot 有 __`两种`__ 需要注意](#block-容器块slot-有-__两种__-需要注意)
- [⭐️ `customGenerateBlocks` 为 `false`(默认值) 的情况](#⭐️-customgenerateblocks-为-false默认值-的情况)
- [⭐️ `customGenerateBlocks` 为 `true` 的情况](#⭐️-customgenerateblocks-为-true-的情况)
- [left 行名slot](#left-行名slot)
- [title 标题slot](#title-标题slot)
- [API](#api)
- [Param](#param)
- [Event](#event)
- [Run Demo](#run-demo)
- [Caution](#caution)
- [Update](#update)
- [License](#license)
## Feature
- 虚拟列表,快速渲染可视区域,支持大量数据渲染
- 可变时间轴,1 分钟,2 分钟,3 分钟,4 分钟~~~到一天
- 支持大小可变
- 支持拖拽
## Screenshot
## Install
### npm 安装
```bash
npm i m-gantt-chart --save
```
Include plugin in your `main.js` file.
```js
import Vue from 'vue'
import mGanttChart from 'm-gantt-chart/dist/m-gantt-chart.common'
Vue.use(mGanttChart)
```
### template code
```html
```
### script code
```js
import Test from "./testOld.vue"; //你自己的gantt条容器
import TestLeft from "./test-left.vue"; //你自己的行名称组件
import { mockDatas } from "@src/mock/index.js"; //伪造的数据
import dayjs from "dayjs" //时间库
export default {
name: "App",
components: { Test, TestLeft },
data() {
return {
startTime: dayjs().toString(),//时间轴开始时间
endTime: dayjs()
.add(2, "d")
.add(2, "h")
.add(5, "s").toString(), //时间结束时间
datas: mockDatas(100), // gantt数据
};
},
};
```
### data
在**默认情况**下(即`customGenerateBlocks`为`false`)的渲染的数据需要**特殊格式** ,目前要求数组中每一个值均为对象,且有`gtAarry`对象数组这个属性(默认取`gtArray`,也可以通过`arrayKeys`属性自定义需要渲染的数组)
数组中每一个对象需有两个属性,`start`和`end`(不提供的情况,偏移与宽度将为0),数值需为合法的时间字符串.例如
```js
[
{
id:'test', //非必须
gtArray:[ //默认的需要渲染的数组
{
name:'test', //非必须
start:'2019-01-11 18:18:18',
end:'2019-01-11 18:18:18'
}
],
customKey:[ //自定义的需要渲染的数组
{
id:'test', //非必须
start:'2019-01-11 18:18:18',
end:'2019-01-11 18:18:18'
}
]
}
]
```
## Slot
```js
// 假设你传入的数据为
[
{
id:'arrayOne',
name:'sala',
gtArray:[
{
name:'itemOne',
start:'2019-01-11 18:18:18',
end:'2019-01-11 18:18:18'
// ...其他属性
}
],
//...其他属性
}
//... 其他数组数据
]
```
### block 容器块slot 有 __`两种`__ 需要注意
#### ⭐️ `customGenerateBlocks` 为 `false`(默认值) 的情况
```html
```
`data` 为 gantt图表中每一行的所有数据
如下
```js
{
id:'arrayOne',
name:'sala',
gtArray:[{...}],
//...
}
```
`item` 为 gantt图表中一个小方块对数据
如下
```js
{
name:'itemOne',
start:'2019-01-11 18:18:18',
end:'2019-01-11 18:18:18'
//...
}
```
#### ⭐️ `customGenerateBlocks` 为 `true` 的情况
此时`arrayKeys`,`itemkey`将不再次生效,如何渲染,渲染什么,将由你自己决定,下方是一个例子
```html
```
`data` 为gantt图表中每一行的所有数据
```js
{
id:'test',
name:'sala',
gtArray:[{...}],
//...
}
```
除了data,还会提供以下属性和函数供调用
`startTimeOfRenderArea`
为当前渲染范围的时间轴开始时间的毫秒数
`endTimeOfRenderArea`
为当前渲染范围的时间轴结束时间的毫秒数
`getPositonOffset(time:string):number `
定位函数,根据给定字符串形式的时间生成相对时间轴起点的的偏移值
`getWidthAbout2Times(start:string,end:string):number`
为宽度计算函数,根据给定字符串形式的时间计算两个时间差的宽度值
`isInRenderingTimeRange(time:string):boolean`
判定给定的时间是否在屏幕显示的时间轴范围之内
`isAcrossRenderingTimeRange(timeStart,timeEnd):boolean`
判定给定的时间是否跨越了屏幕显示的时间轴范围之内
### left 行名slot
```html
```
`data` 为 gantt图表中每一行的所有数据
```js
{
id:'test',
name:'sala',
gtArray:[{...}],
//...
}
```
### title 标题slot
```html
hola
```
## API
### Param
| param | required | type | default | describe |
| :-------------- | :------: | :-----: | :----: | :---- |
| startTime | ❌ | string | 当前时间 | 时间轴开始时间,需为合法的时间字符串,如:`2019-01-11 18:18:18`|
| endTime | ❌ | string | 当前时间 | 时间轴结束时间,需为合法的时间字符串,如:`2019-01-11 18:18:18`|
| cellWidth | ❌ | number | 50 | 时间区间的宽度 |
| cellHeight | ❌ | number | 20 | 时间区间的高度 |
| titleHeight | ❌ | number | 40 | 表头的高度 |
| titleWidth | ❌ | number | 200 | 表头和行的宽度 |
| scale | ❌ | number | 60 | 时间轴的刻度值。单位:分钟,允许值`[1, 2, 3, 4, 5, 6, 10, 12, 15, 20, 30, 60, 120,180,240,360, 720, 1440] ` |
| datas | ❌ | array | [] | 在**默认情况**下(即`customGenerateBlocks`为`false`)的渲染的数据需要**特殊格式** ,目前要求数组中每一个值均为对象,且有gtAarry对象数组这个属性,gtArray中每一个对象需有两个属性,start和end(不提供的情况,偏移与宽度将为0),需为合法的时间字符串.例如```[{id:'test',gtArray:[{start:'2019-01-11 18:18:18',end:'2019-01-11 18:18:18'}]}] ``` 其他不做限制。 |
| arrayKeys| ❌ | array | ["gtArray"] | 需要渲染的数组的key |
| dataKey | ❌ | string | -- | 渲染的每一行的key |
| itemKey | ❌ | string | -- | 渲染的每一个gantt容器的key |
| showCurrentTime | ❌ | boolean | false | 显示当前时间,每秒钟更新 |
| timelines | ❌ | array | -- | 显示标记时间,有特殊格式 ``` [{time:'2019-01-11 18:18:18',color:'#00000'}]``` |
| scrollToTime | ❌ | string | -- | 滚动到指定的时间,需为合法的时间字符串 |
| scrollToPostion | ❌ | object | -- | 滚动到指定的位置 格式为``` {x:number,y:number}``` |
| hideHeader | ❌ | boolean | false | 隐藏时间轴和表头 |
| hideXS | ❌ | boolean | false | 隐藏时间轴和表头 |
| hideXScrollBar | ❌ | boolean | false | 隐藏横向滚动轴 |
| hideYScrollBar | ❌ | boolean | false | 隐藏纵向滚动轴 |
| customGenerateBlocks | ❌ | boolean | false | 开启自定义生成渲染块,具体使用见说明 |
| timeRangeCorrection | ❌ | boolean | false | 时间矫正,默认开启。关闭后时间轴不会自动填充剩余空间,错误的先后时间会引起错误 |
| preload | ❌ | number | 1 | 可视范围外渲染行数。如值为1时,屏幕只能显示10条,但是会顶部,底部会多渲染一条,避免滚动时出现空白。当值为0,渲染全部数据 |
### Event
| event | type | describle|
| :--- |:-----:|:---------|
| scrollLeft| number | X轴的滚动值|
| scrollTop | number | Y轴的滚动值|
## Run Demo
### 注意项目需要 node 环境
```bash
#clone项目,进入项目根目录
#安装
npm i
# 启动
npm run serve
or
yarn serve
#打开浏览器地址栏输入localhost:8080即可
```
## Caution
- IE 需要自己处理一些ployfill,应该是promise
- MacOS �系统需要在偏好设置中的通用开启始终显示滚动条,否则可能会看不到滚动条
- 注意查看vue 版本,不是2.6以上vue版本,不能直接使用demo中的v-slot的语法,需要使用旧的slot 语法[2.6之前的slot 语法](https://cn.vuejs.org/v2/guide/components-slots.html#%E5%BA%9F%E5%BC%83%E4%BA%86%E7%9A%84%E8%AF%AD%E6%B3%95)
```js
// 2.6+语法
```
```js
// 2.6之前的语法
//<--------区别在这里
```
## Update
## License
_MIT_ ©wuchouchou