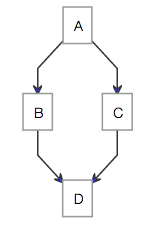
graph TD;
    A-->B;
    A-->C;
    B-->D;
    C-->D;
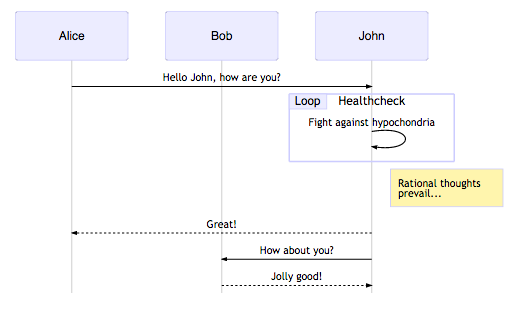
sequenceDiagram
    participant Alice
    participant Bob
    Alice->John: Hello John, how are you?
    loop Healthcheck
        John->John: Fight against hypochondria
    end
    Note right of John: Rational thoughts <br/>prevail...
    John-->Alice: Great!
    John->Bob: How about you?
    Bob-->John: Jolly good!