# ng-morris-js
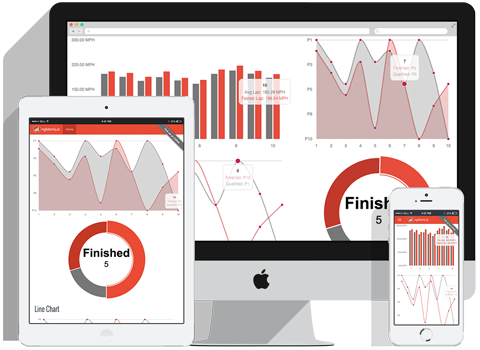
Super Easy AngularJS Chart Directives for [MorrisJS](http://morrisjs.github.io/morris.js/index.html) Charts.
**ng-morris-js** doesn't limit chart options - use ANY or ALL of Morris Chart's native [Area, Line](http://morrisjs.github.io/morris.js/lines.html), [Bar](http://morrisjs.github.io/morris.js/bars.html) and [Donut](http://morrisjs.github.io/morris.js/donuts.html) options.
## [Demo Site](http://jboothe.github.io/ngMorrisJs/)
Our Demo Site has many useful examples and usage tips.
## Features
* Super Easy to Use
* Use Any/All MorrisJS Options
* Inverse Axes Tips
* Demos & Tutorials
* Angular Best Practices
### Installation
From terminal/command prompt, install the ng-morris-js package with bower or npm.
```bash
bower install ng-morris-js
// or
npm install ng-morris-js
```
### Include Script and CSS References
If `npm install` was used, substitute `bower_components` with `node_modules` in paths below.
```html
```
### Add Module Reference
Add the `ng-morris-js` module reference along with others required by your app.
```javascript
(function () {
angular
.module('app', [
'ng-morris-js'
]);
}());
```
### Usage HTML
Declare the directive and the two attributes, chart-options & chart-data.
```html
```
### Usage JS
Create an object in your Controller to store the chart options & data.
```javascript
myCtrl.myBarChart = {
data: [
{year: '2015 Q1', sales: 3, net: 2, profit: 1},
{year: '2015 Q2', sales: 2, net: 0.9, profit: 0.45},
{year: '2015 Q3', sales: 1, net: 0.4, profit: 0.2},
{year: '2015 Q4', sales: 2, net: 1, profit: 0.5}
],
options: {
xkey: 'year',
ykeys: ['sales', 'net', 'profit'],
labels: ['Sales', 'Net', 'Profit'],
barColors: ['#777777', '#e74c3c', 'rgb(11, 98, 164)']
}
};
```
## Change Log
Please see [CHANGELOG](https://github.com/jboothe/ngMorrisJs/CHANGELOG.md).
## Authors
Jeff Boothe (@dezeloper)
[reurgency.com](http://reurgency.com)
## Contributing
1. Create an issue to discuss your idea
2. [Fork it](https://github.com/jboothe/ngMorrisJs/fork)
3. Create your local feature branch (`git checkout -b my-new-feature`)
4. Commit your changes (`git commit -am 'Adding my new feature'`)
5. Push to the branch (`git push origin my-new-feature`)
6. Create a new Pull Request
## Credits
Inspired by Connor Leech's [ngMorris](https://github.com/cleechtech/ng-morris)
## License
Please see [LICENSE](https://github.com/jboothe/ngMorrisJs/LICENSE)

 ## [Demo Site](http://jboothe.github.io/ngMorrisJs/)
Our Demo Site has many useful examples and usage tips.
## Features
* Super Easy to Use
* Use Any/All MorrisJS Options
* Inverse Axes Tips
* Demos & Tutorials
* Angular Best Practices
### Installation
From terminal/command prompt, install the ng-morris-js package with bower or npm.
```bash
bower install ng-morris-js
// or
npm install ng-morris-js
```
### Include Script and CSS References
If `npm install` was used, substitute `bower_components` with `node_modules` in paths below.
```html
```
### Add Module Reference
Add the `ng-morris-js` module reference along with others required by your app.
```javascript
(function () {
angular
.module('app', [
'ng-morris-js'
]);
}());
```
### Usage HTML
Declare the directive and the two attributes, chart-options & chart-data.
```html
## [Demo Site](http://jboothe.github.io/ngMorrisJs/)
Our Demo Site has many useful examples and usage tips.
## Features
* Super Easy to Use
* Use Any/All MorrisJS Options
* Inverse Axes Tips
* Demos & Tutorials
* Angular Best Practices
### Installation
From terminal/command prompt, install the ng-morris-js package with bower or npm.
```bash
bower install ng-morris-js
// or
npm install ng-morris-js
```
### Include Script and CSS References
If `npm install` was used, substitute `bower_components` with `node_modules` in paths below.
```html
```
### Add Module Reference
Add the `ng-morris-js` module reference along with others required by your app.
```javascript
(function () {
angular
.module('app', [
'ng-morris-js'
]);
}());
```
### Usage HTML
Declare the directive and the two attributes, chart-options & chart-data.
```html