Node-red-domotz is a Node-Red plugin providing easy access to the Domotz Public API. It offers a convenient way to explore the APIs, automate flows, create custom dashboards and integrate Domotz data with external tools. With Node-red-domotz you don’t have to be a skilled programmer to get the most out of the public API.
The following tutorial will help you get started with Node-red-domotz and learn how to build a custom dashboard with it.
For the installation instructions of Node-Red please refer to the official guide. You can install the Domotz node from the ‘manage palette’ menu of Node-Red. Just search for node-red-contrib-domotz and install it. In the rest of this tutorial we will rely on the excellent node-red-dashboard plugin, so I recommend installing it as well.
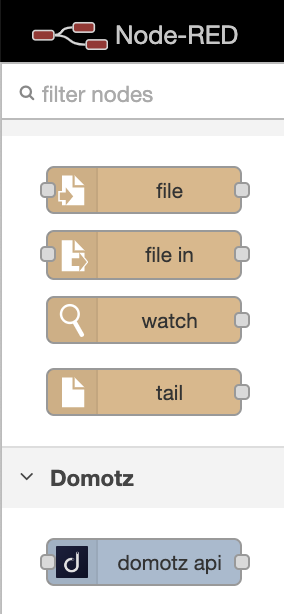
After a successful installation the domotz-api node should be available in the palette, ready to be dragged in the workspace.
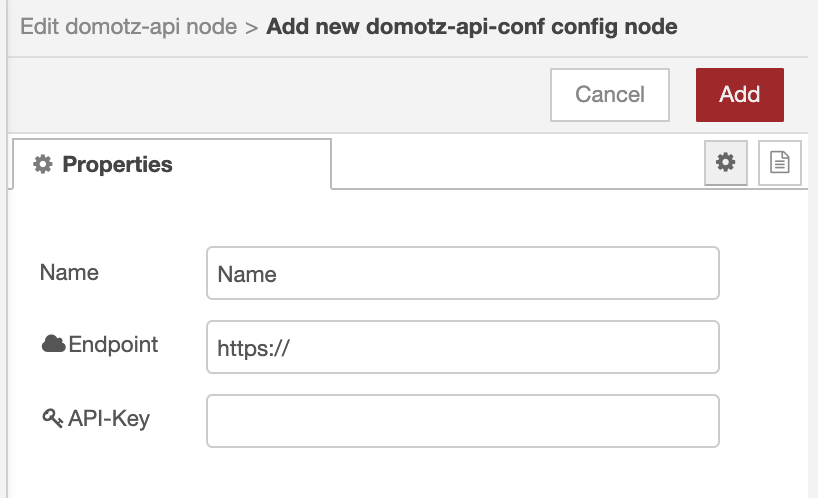
For the node to be functional you need to configure the access info using your API-Key and your endpoint. Multiple access keys are supported, thus you can manage multiple accounts from the same workspace.
Once the access info is configured you can select any API method from the dropdown list.
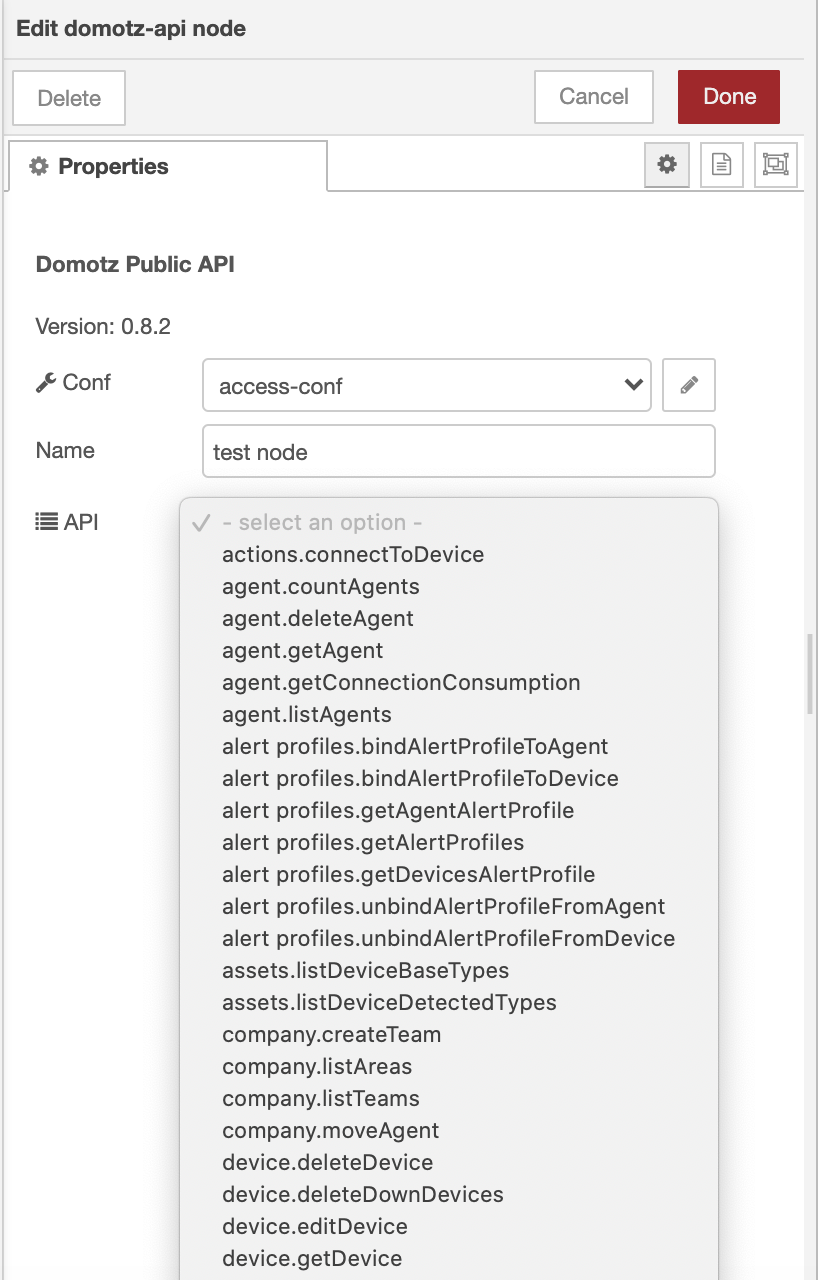
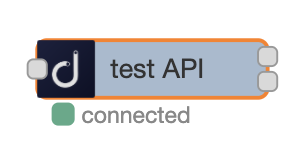
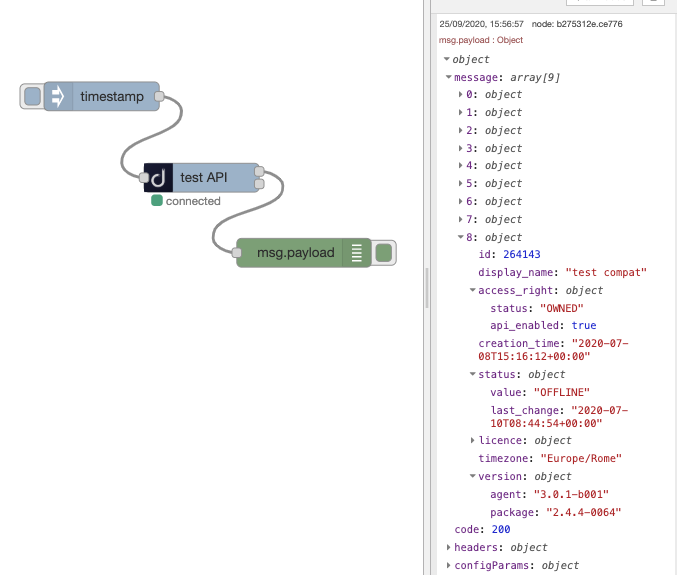
Let’s select agent.listAgents to retrieve the IDs of all the available agents and click ‘Deploy’. If the provided access configuration is valid you should see a green marker next to the node.
Now we can create an inject node to trigger the API call and a debug node to display the output. The inject node can be easily configured to send a periodic trigger, enabling auto refresh of the data. Again, deploy and click inject. In the debug space you will see the API output from which you can extract all the available information about your agents.
Now that we learned how to deploy a Domotz node let’s see how we can parse the output to create a custom dashboard displaying camera snapshots, RTD and SNMP charts. The API methods of the following examples require some additional configuration, namely agent, device, and SNMP sensor IDs. Make sure you have them ready, you can retrieve them using agent.listAgents, as seen before, device.listDevices and eyes.listEyesSNMP. You can specify the IDs directly in the node’s configuration window or pass them in the input message (e.g., using and injector node with a payload like this {"params": {"agent_id": "123456"}})
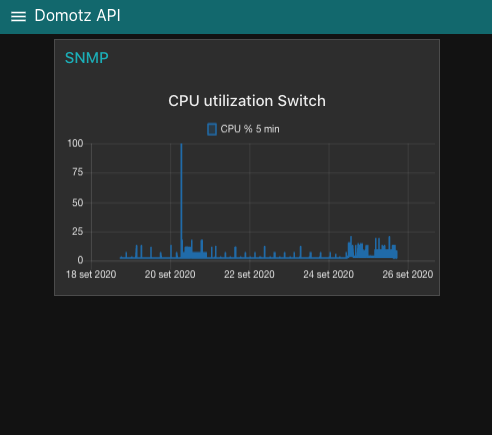
Select eyes.getEyesSNMPHistory, configure it with the right agent, device and sensor ID and connect its main output to a function node. Then connect the function node to a chart widget. The following function code transforms the input data sequence (msg.payload.message) in the format required by the chart.
data = [
    {
        'series': ['CPU % 5 min'],
        'data': [
            [],
        ],
        'labels': ['CPU % 5 min'],
    },
];

dataIn = msg.payload.message;

for (var i = 0; i < dataIn.length; i++) {
    sample = dataIn[i];
    ts = sample.timestamp;
    data[0]['data'][0].push({'x': ts, 'y': sample.value});
}

msg = {
    payload: data,
};

return [msg];
The following images display the wiring and the resulting chart. 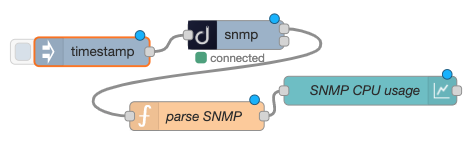
For metrics.getDeviceRTDHistory we can use a similar approach, only this time we have three different data series to display: maximum, minimum and median.
data = [
    {
        'series': ['median', 'min', 'max'],
        'data': [
            [],
            [],
            [],
        ],
        'labels': ['median', 'min', 'max'],
    },
];

dataIn = msg.payload.message;

for (var i = 0; i < dataIn.length; i++) {
    sample = dataIn[i];
    ts = sample.timestamp;
    data[0]['data'][0].push({'x': ts, 'y': sample.median});
    data[0]['data'][1].push({'x': ts, 'y': sample.min});
    data[0]['data'][2].push({'x': ts, 'y': sample.max});
}

msg = {
    payload: data,
};

return [msg];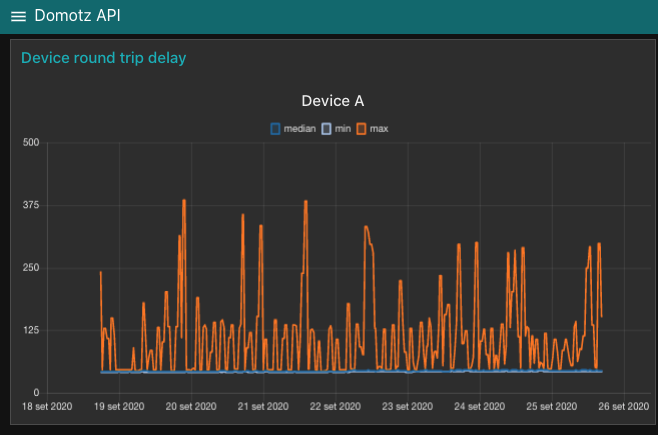
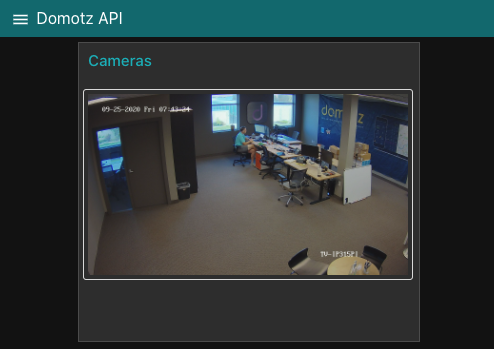
The multimedia.onvifSnapshot allows taking a snapshot from an Onvif camera. To display the image in our dashboard we won’t need a specific function node as we will perform the data parsing in a template node, directly connected to the main output of the snapshot node. The following code, (to be added to the template node) waits for a new message, creates a Blob from the binary data and sets it as source of an image tag.
<div>
    <style>
        img {
            border: 1px solid #ddd;
            border-radius: 4px;
            padding: 5px;
            width: 400px;
        }
    </style>

    <script>
        (function (scope) {
            scope.$watch('msg', function (msg) {
                if (msg) {
                    var b = new Blob([msg.payload.message], {type: 'image/jpeg'});
                    scope.image = URL.createObjectURL(b);
                }
            });
        })(scope);

    </script>
    <img ng-src="{{image}}"/>
</div>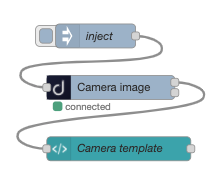
In this tutorial we’ve seen how to create a custom dashboard using data extracted from the Domotz API. With little programming effort, the Domotz Node Red package allows to easily interact with the Domotz API.
In the next tutorial we’ll see how the leverage Domotz Webhooks and the Public API to create automated response to network event notifications.