In the previous tutorial we’ve seen how to install and use Node-red-domotz to build a custom dashboard
leveraging the Domotz Public API.
In this tutorial we’ll learn how to: * setup a Webhook management system using Node-Red * enrich the dashboard
displaying live Domotz events * automatically respond to a network event through the Domotz Public API
Domotz allows you to subscribe to events happening on agents and devices and to receive Webhooks when they occur. You
can find more information about Webhook configuration and data format on the Domotz Portal. In the rest of the tutorial
we’ll assume that you correctly configured a Shared alert and attached it to at least one agent/device.
Setting-Up the Webhook listener
To be able to receive Webhooks from Domotz you need to expose a web server on a public IP address. The Node-Red installation guide can help you deploying your Node-Red
flow on a public server. It is strongly recommended to secure the endpoint, using HTTPS
and to set up an authentication mechanism.
Create and test the server
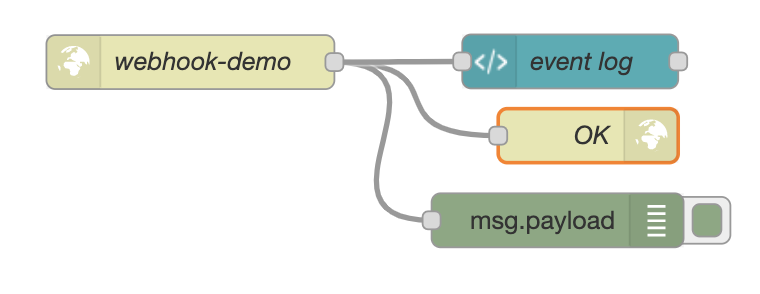
Once Node-Red is started we can create the web server using the http in node. Just drag it into the
workspace and configure it with a URL suffix (webhook-test in this case). Method must be
POST. This is just a receiver node, any HTTP client expects a
response so we need to create also a http response node. Domotz Webhook service expects a response with
code 201 and an empty body, hence we can directly attach the http response node to to the
output of the http in node. Let’s also add a debug node to the same output to monitor the received
messages. Once deployed the flow you can test the endpoint using any
HTTP client (curl,Postman) issuing a POST request like the following:
Just remember to replace your-node-red-service-ip with the actual IP address of your server and to add
the authentication header to the request if needed.
If the configuration is correct this is what you should see in the debug panel. #
Enriching the dashboard In the previous tutorial we’ve seen how to feed Domotz Public-API data in a Node-Red custom
dashboard. In that scenario we used to poll the Domotz Public-API servers using the Domotz Node-Red node. Now we
subscribe to Domotz events, receive and display data directly pushed from Domotz into the same dashboard. Keep in
mind that the two approaches can happily coexist and they are useful for different purposes.
The following setup is simple but powerful as it allows creating a live event log of everything happening on our
Domotz agents. To do that, let’s create a new dashboard template node.
template_node
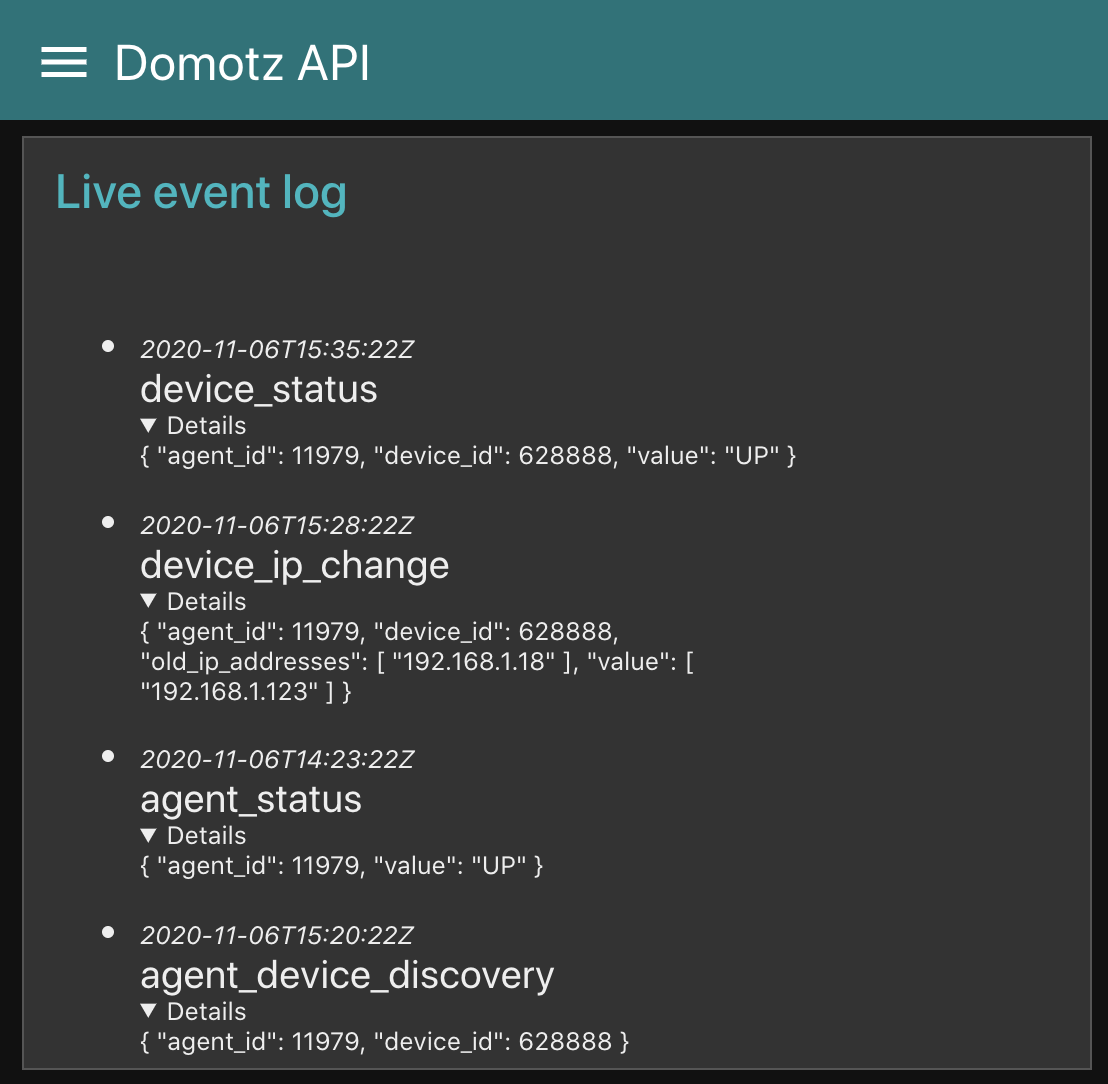
You can use the following code in the template to parse and display the incoming Domotz events in a list.
Each time a new message is received the $watch callback is invoked with the newly-received message. What we do in the
callback is to unpack the content of the message into three parts (name, timestamp, and details), which are common
to all Domotz Webhooks, and insert them at the top of a simple list. You can see the result in the following image.
Advanced event parsing and automatic reaction
In the previous example we treated each message in the same way, that is, take its content and display it in a
dynamic list. If we want to respond to a specific event then we need to define a custom parsing function.
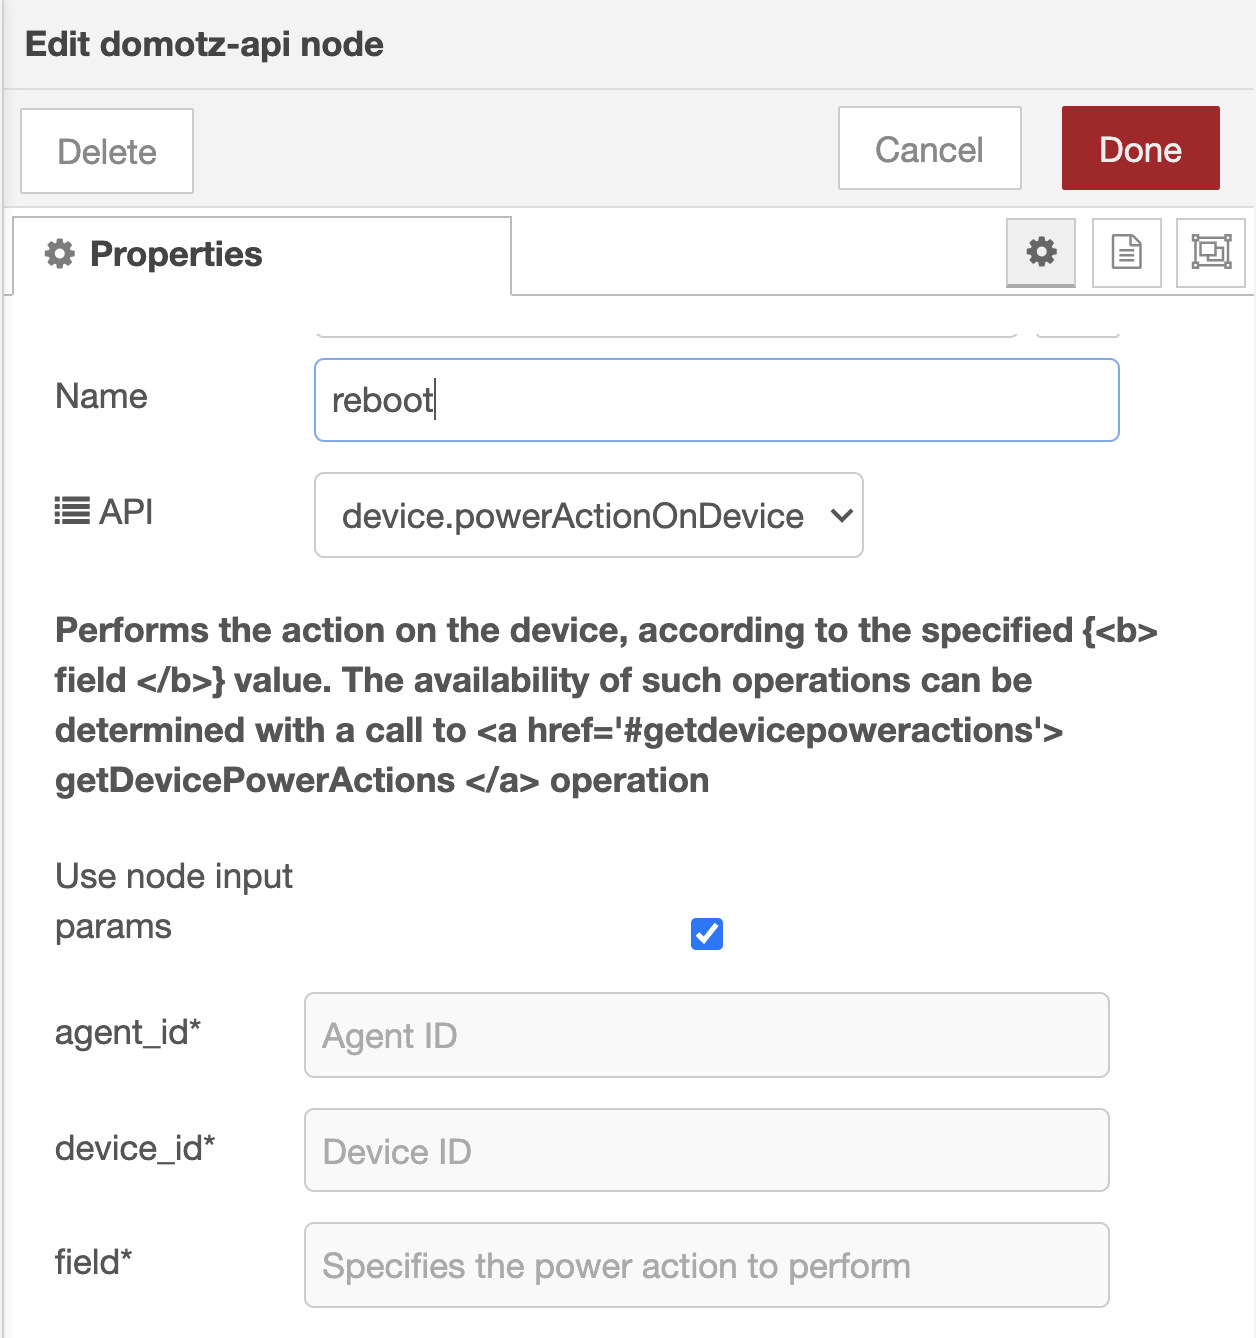
In the next example we chain a webhook event handler (Round-Trip-Delay issue on a device) with a Public API call
(restarting the device itself). The RTD issue event is described here and is generated when Domotz
detects that the RTD values exceeds the defined thresholds. We then use the powerActionOnDevice API call to perform
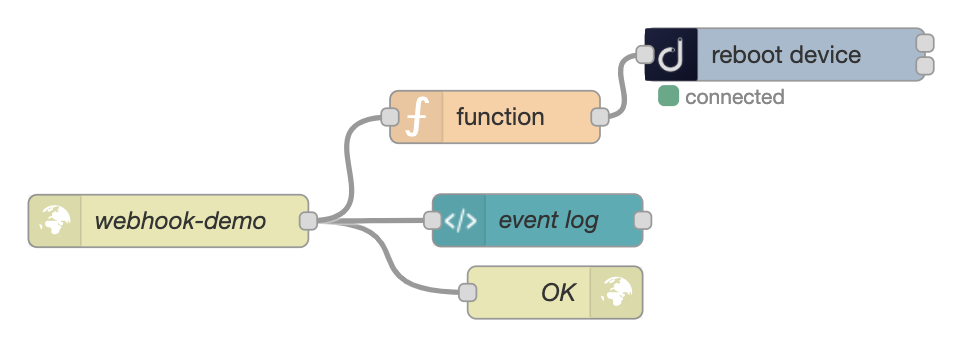
a power cycle on the device. The following images display the wiring and configuration of the nodes.
reboot_confreboot_wiring
A function node is needed to: * filter the unrelated webhook events (we are only interested in events named device_rtd)
* extract the information required to perform a reboot (agent_id and device_id) from the
event body
The information we extracted are returned as output of the function node and become the input of the API node
(remember to check the Use node input params option in the Domotz node in this case. You can use the
following code in the function node:
That’s it, the next time a RDT event will be detected by Domotz our flow will automatically reboot the device.
Testing Tips
Waiting for a webhook from Domotz can be tiresome, after all they are only triggered when something really
happens on your networks. If you are interested in developing a Webhook handler a quick way to test your integration
is to generate fake events using an HTTP client (as described before). You can forge a body simply copying the Events
examples provided in the schemas section of the
documentation
Conclusion
Node-Red can be a powerful tool to customise your Domotz experience. In conjunction with the Node-red-domotz plugin and the Domotz Webhook
service it allows you to create custom application logic and beautiful dashboards.
 This is just a receiver node, any HTTP client expects a
response so we need to create also a
This is just a receiver node, any HTTP client expects a
response so we need to create also a  Once deployed the flow you can test the endpoint using any
HTTP client (curl,Postman) issuing a POST request like the following:
Once deployed the flow you can test the endpoint using any
HTTP client (curl,Postman) issuing a POST request like the following: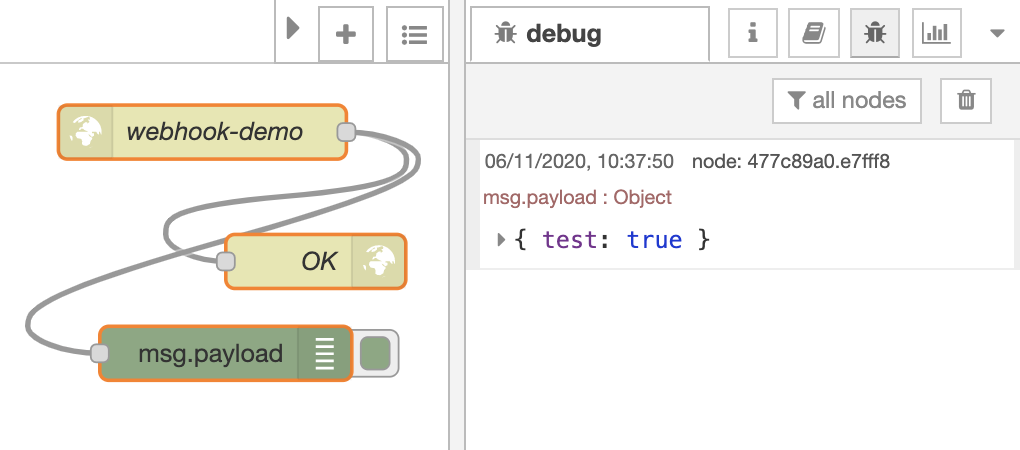 #
Enriching the dashboard In the previous tutorial we’ve seen how to feed Domotz Public-API data in a Node-Red custom
dashboard. In that scenario we used to poll the Domotz Public-API servers using the Domotz Node-Red node. Now we
subscribe to Domotz events, receive and display data directly pushed from Domotz into the same dashboard. Keep in
mind that the two approaches can happily coexist and they are useful for different purposes.
#
Enriching the dashboard In the previous tutorial we’ve seen how to feed Domotz Public-API data in a Node-Red custom
dashboard. In that scenario we used to poll the Domotz Public-API servers using the Domotz Node-Red node. Now we
subscribe to Domotz events, receive and display data directly pushed from Domotz into the same dashboard. Keep in
mind that the two approaches can happily coexist and they are useful for different purposes.