## React Animated Charts

React animated chart library by using D3.js

## Install

Install the package using npm:

### `npm i react-animated-web`

Give Feedback or Report Issues on GitHub:

### [`github.com/code-ayush/animated-web`](https://github.com/code-ayush/animated-web)


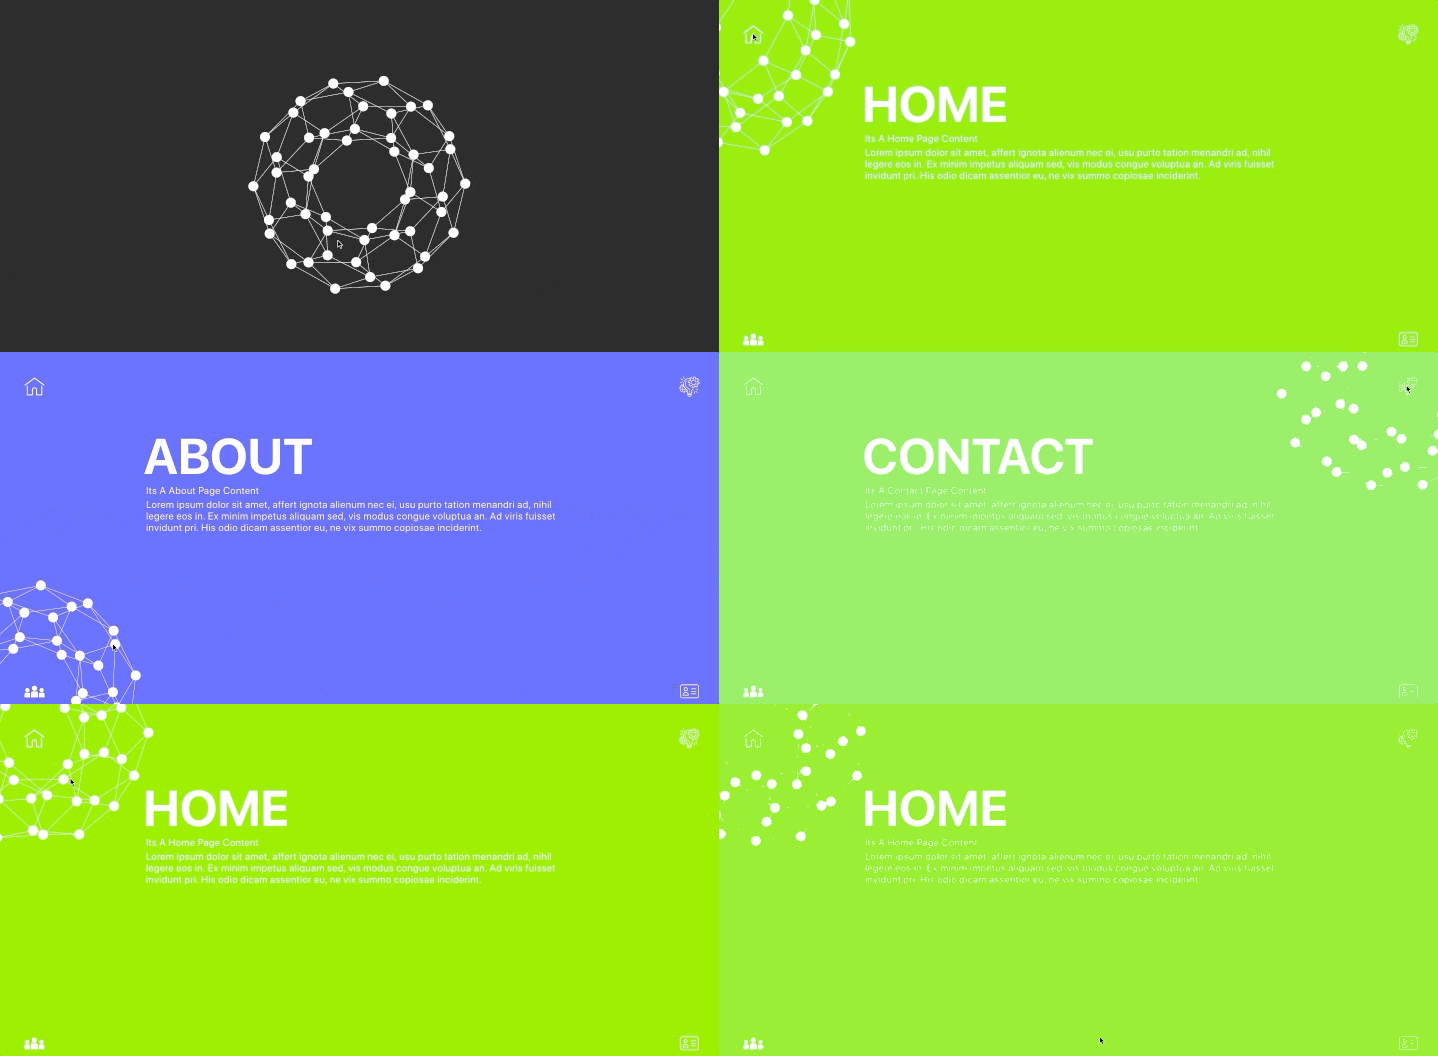
## Example Animation
![Example](https://res.cloudinary.com/dclpozjga/image/upload/v1576671197/ExampleMain_iec9vf.gif)


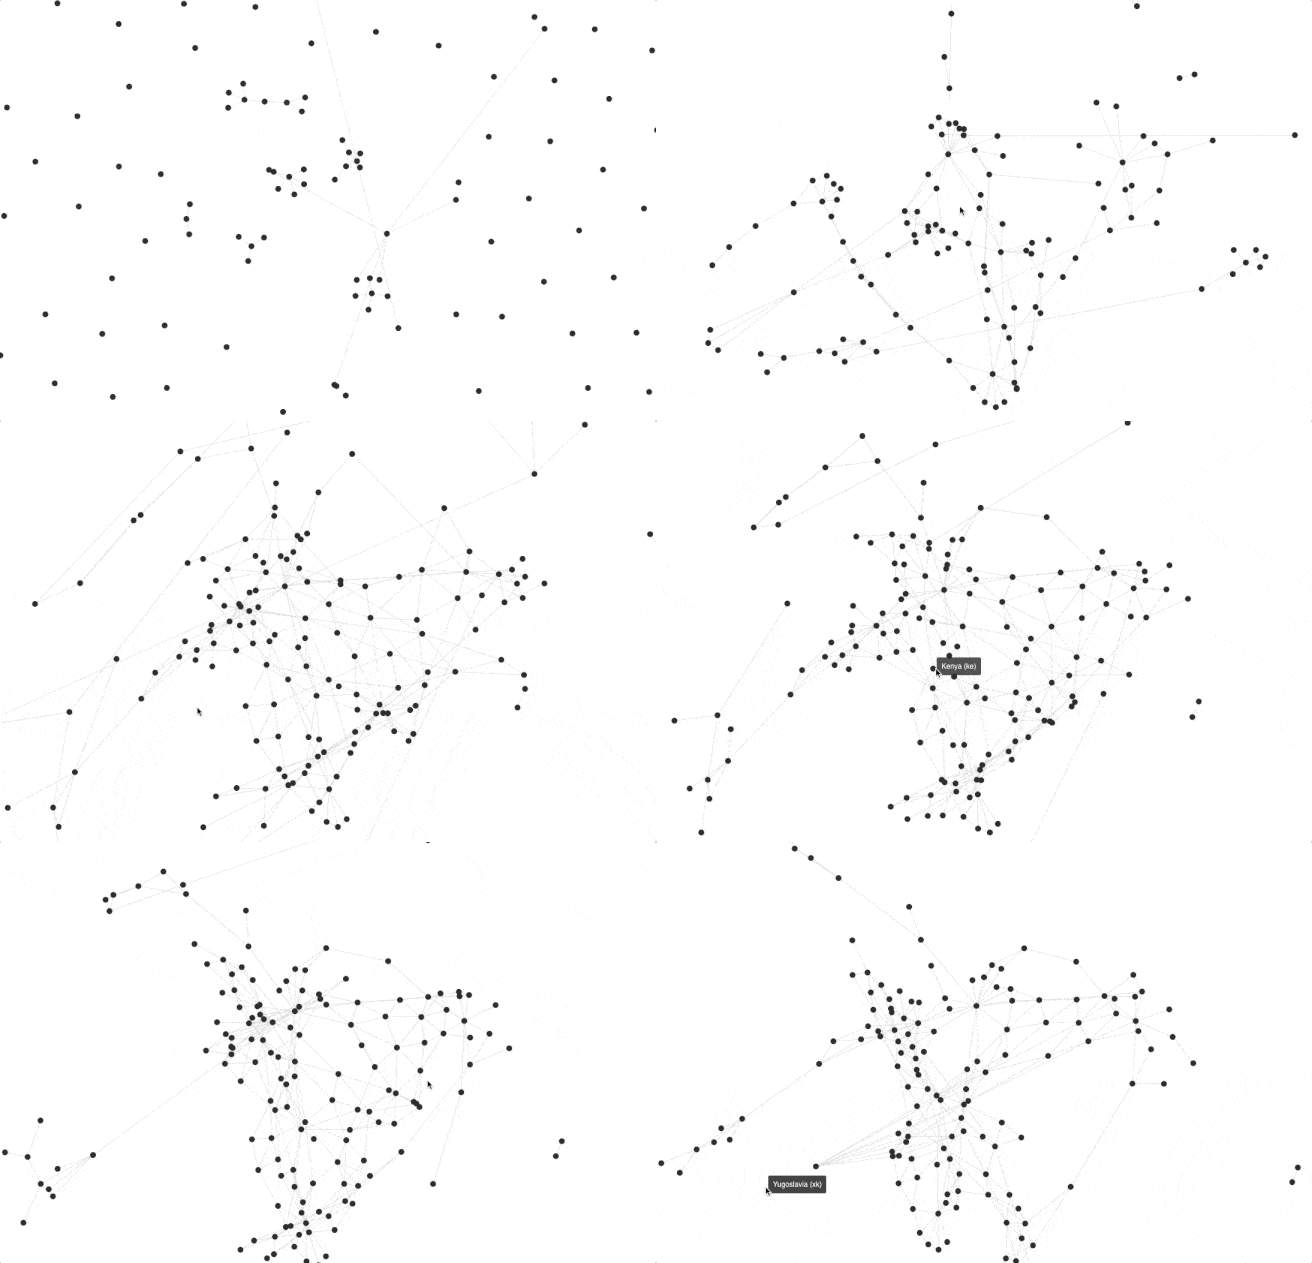
## Force-Directed Graph

![Force-Directed Graph](https://res.cloudinary.com/dclpozjga/image/upload/v1576649639/FDGraph_khsgru_jurwvc.gif)

```javascript
import { ForceDirectedGraph } from "react-animated-web"; // ES6 Syntax

<ForceDirectedGraph
    drag={true}                 // Enables Mouse Drag (true/false)
    nodes={node}                // Graph Nodes (Array of Object)
    links={link}                // Graph Links (Array of Object)
    alphaDecay={0.01}           // Alpha Decay (Number Range - [0,1])
    animationDelay={10}         // Animation Delay Time (Time in `ms`)
    animationStart={0}          // Animation Start time (Time in `ms`)
    height={500}                // Height of Graph (Number)
    width={500}                 // Width of Graph (Number)
    strength={0.4}              // Strength of Graph (Number Range - [0,1])
    distance={10}               // Distance between each node (Number)
    nodeRadius={3}              // Radius of each node (Number)
    nodeColour={'#121212'}      // Colour of Nodes (String)
    linkStroke={'#cdcdcd'}      // Colour of Links (String)
    linkOpacity={1}             // Opacity of Links (Number Range - [0,1])
    toolTip={true}              // Enables ToolTip (true/false)
/>
```

### Note

```javascript
const node = [{tag: "_name",id: "_id"}...]
const link = [{target: "_targetIndex", source: "_sourceIndex"}...]
```


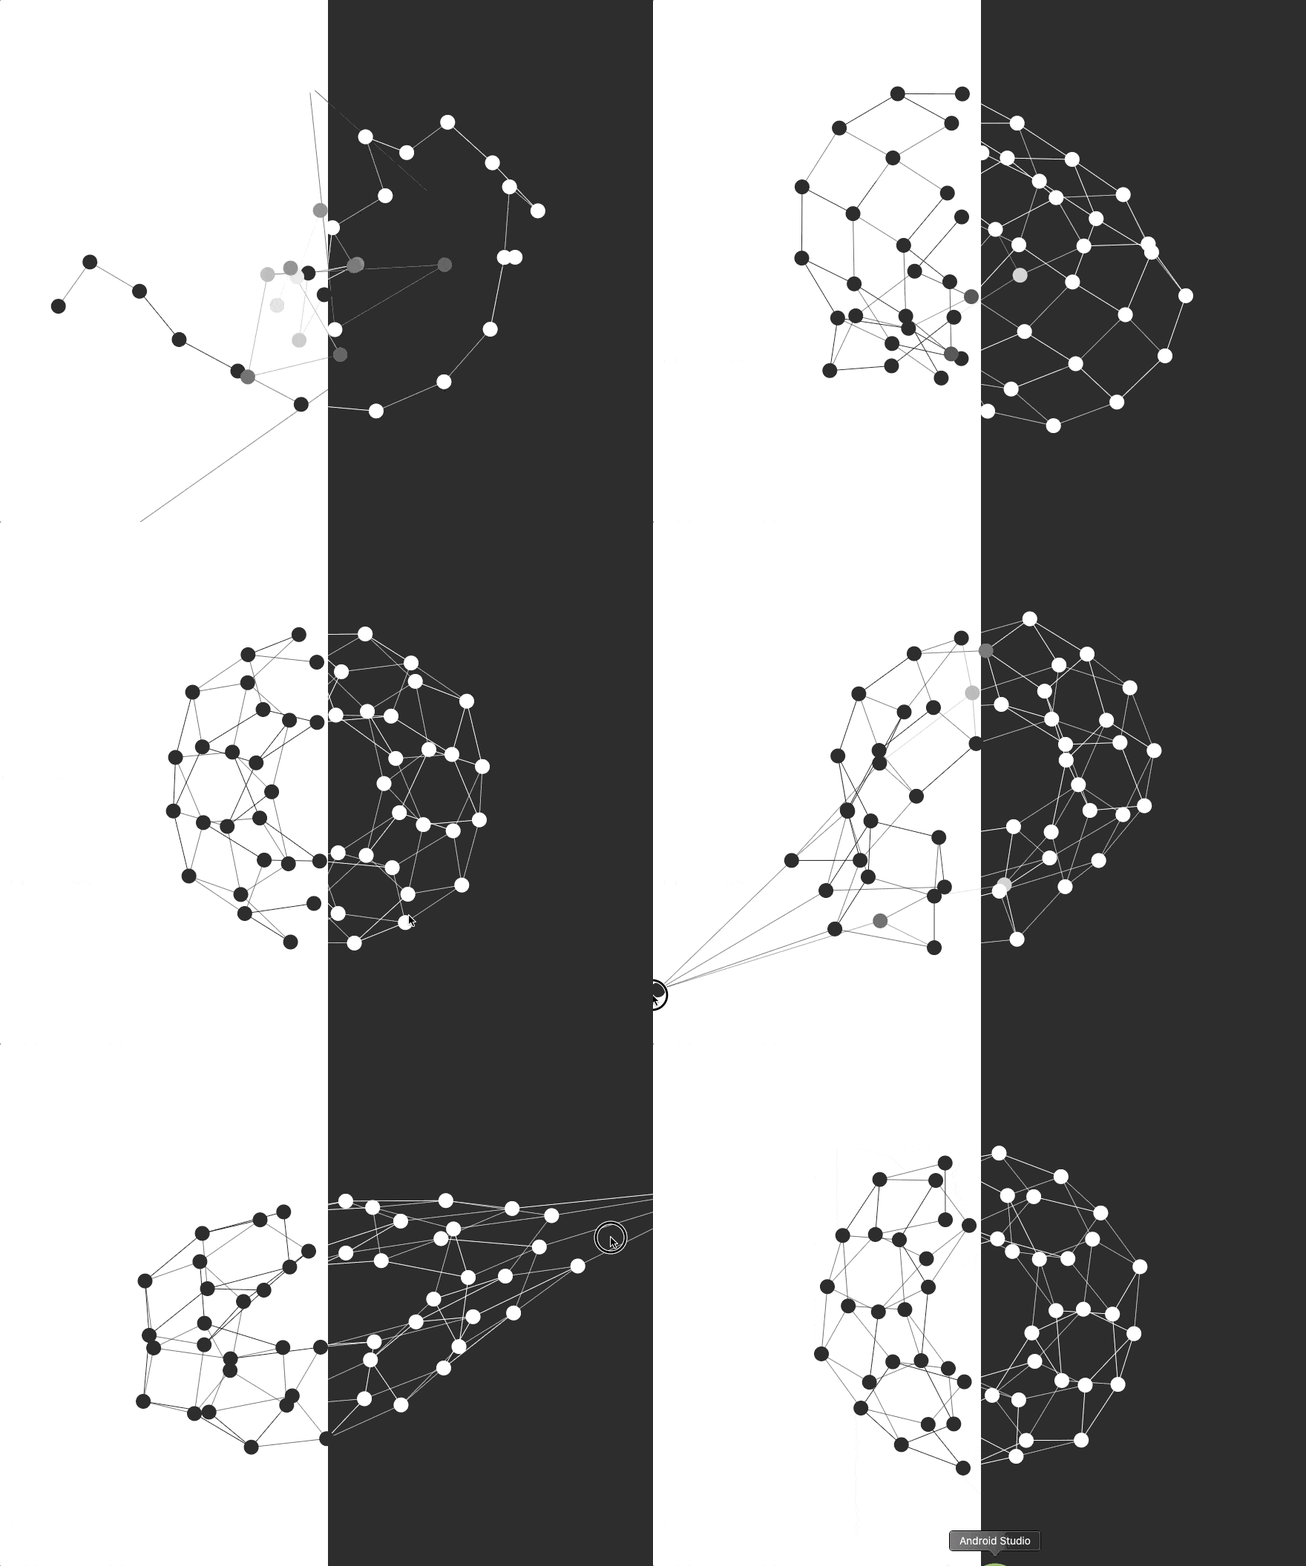
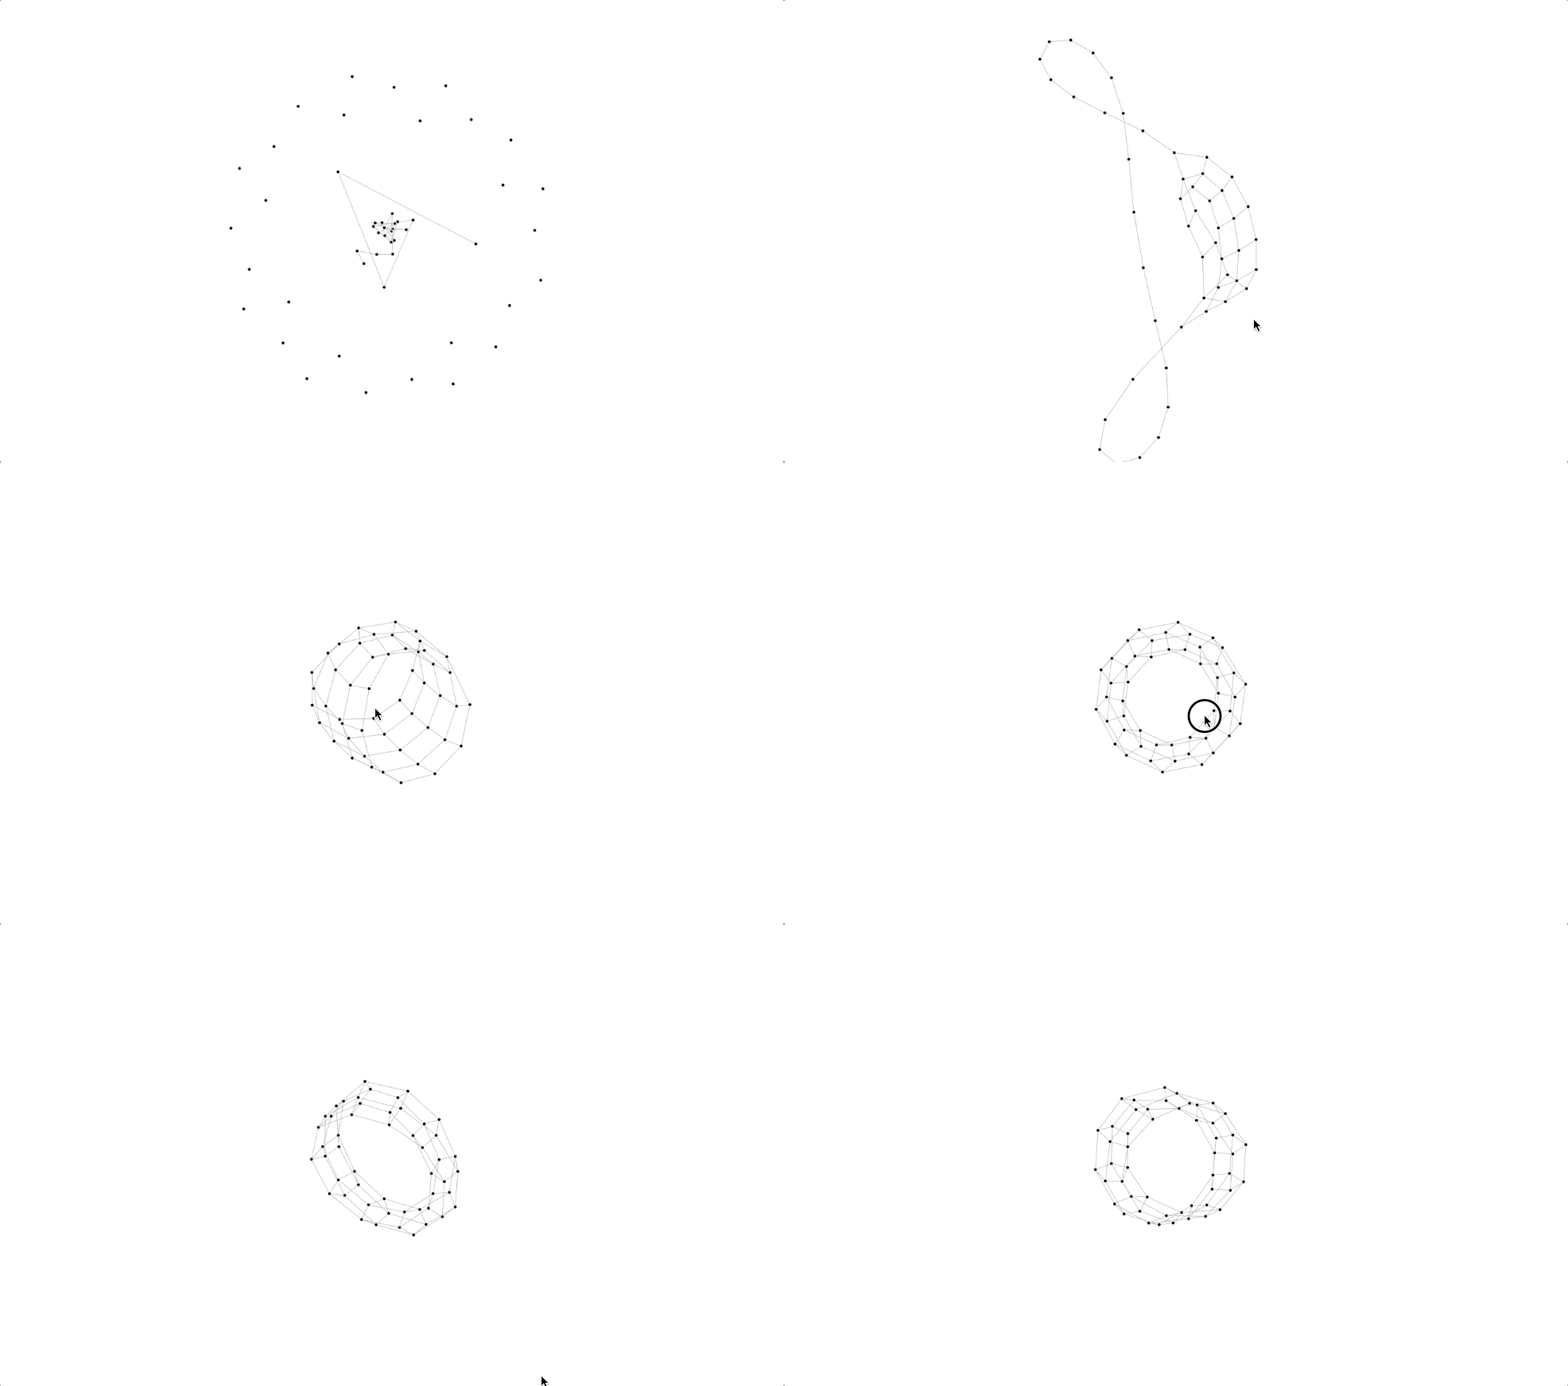
## Hamiltonian Graph
![Hamiltonian Graph](https://res.cloudinary.com/dclpozjga/image/upload/v1576483530/HGraph_snzoxl.gif)

![Example](https://res.cloudinary.com/dclpozjga/image/upload/v1576484657/example_emgvfv.gif)

```javascript
import { HamiltonianGraph } from "react-animated-web"; // ES6 Syntax

<HamiltonianGraph
    drag={true}                 // Enable Mouse Drag (true/false)
    noOfNode={50}               // Graph Nodes (Number)
    linkFactor={10}             // Graph Links (Number)
    alphaDecay={0.01}           // Alpha Decay (Number Range - [0,1])
    animationDelay={10}         // Animation Delay Time (Time in `ms`)
    velocityDecay={0.1}         // Velocity Decay (Number Range - [0,1])
    animationStart={0}          // Animation Start time (Time in `ms`)
    height={500}                // Height of Graph (Number)
    width={500}                 // Width of Graph (Number)
    strength={0.4}              // Strength of Graph (Number Range - [0,1])
    distance={10}               // Distance between each node (Number)
    zIndex={0}                  // Z-Index for Graph (Number)
    nodeRadius={3}              // Radius of each node (Number)
    nodeColour={'#121212'}      // Colour of Nodes (String)
    linkStroke={'#cdcdcd'}      // Colour of Links (String)
    linkOpacity={1}             // Opacity of Links (Number Range - [0,1])
    colorAnimation={false}      // Colour Animation (true/false)
    clrAnimationCenter={250}    // Animation Center (Number)
    linkAniClr={'#fff'}         // Second Link Colour for Animation (String)
    nodeAniClr={'#fff'}         // Second Node Colour for Animation (String)
    dragEventCallBack={function}// Drag Event CallBack Function (Function)
    alphaMin={1}                // Alpha Min (Number Range - [0,1])
/>
```


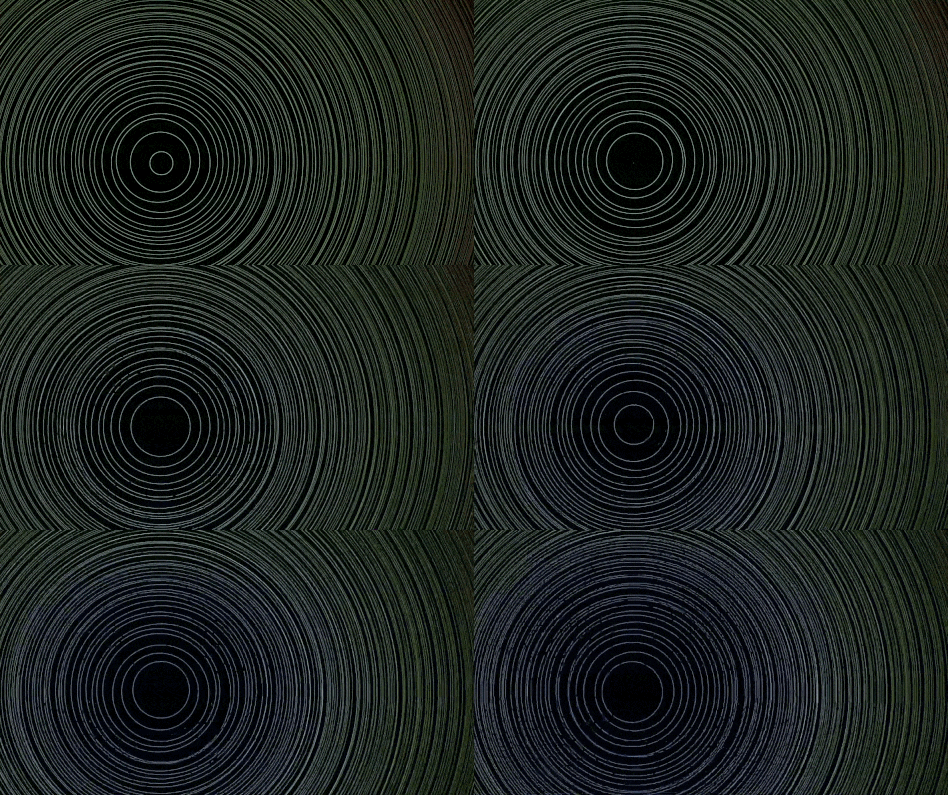
## Circle Flow Animation

![Circle Flow Animation](https://res.cloudinary.com/dclpozjga/image/upload/v1576484827/CircleFlow_kdnomd.gif)

```javascript
import { CircleFlow } from "react-animated-web"; // ES6 Syntax

<CircleFlow
    height={500}                // Height of Graph (Number)
    width={500}                 // Width of Graph (Number)
    backgroundColor={'black'}   // Background Color (String)
    duration={2000}             // Animation Duration (Time in ms - Number)
    radius={100}                // Circle Radius (Number)
/>
```


## Circle Animation

![Circle Animation](https://res.cloudinary.com/dclpozjga/image/upload/v1576485348/CircleAnimation_yv5kij.gif)

```javascript
import { CircleAnimation } from "react-animated-web"; // ES6 Syntax

<CircleAnimation
    height={500}                // Height of Graph (Number)
    width={500}                 // Width of Graph (Number)
    backgroundColor={'black'}   // Background Color (String)
    duration={2000}             // Animation Duration (Time in ms - Number)
    radius={100}                // Circle Radius (Number)
    xIndex={100}                // Center x-coordinate of Circle (Number)
    yIndex={100}                // Center y-coordinate of Circle (Number)
/>
```


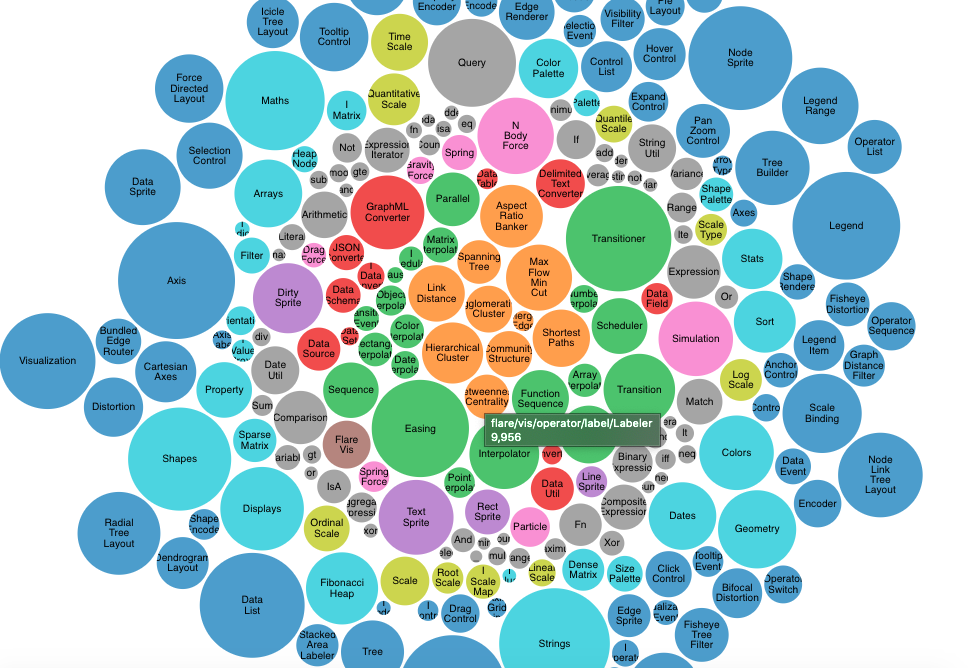
## Bubble Chart

![Bubble Chart](https://res.cloudinary.com/dclpozjga/image/upload/v1576483529/BubbleChart_yhwtgo.png)

```javascript
import { BubbleChart } from "react-animated-web"; // ES6 Syntax

<BubbleChart
    height={500}                // Height of Graph (Number)
    width={500}                 // Width of Graph (Number)
    tooltipSize={10}            // Tooltip text Size (Number)
    tooltipColor={'black'}      // Tooltip text Color (String)
    tooltipFont={"sans-serif"}  // Tooltip text Font (String)
    chartData={[]}              // Chart Data (Array)
    colourSet={[]}              // Chart Colour set (Array)
    fillOpacity={0.7}           // Fill Opacity (Number Range - [0,1])
/>
```

### Note

```javascript
const chartData = [{ name: "_name", group: "_group", value: _value }...]
const colourSet = ['#000','balck',...]
```