# react-native-bullet-graph
Add customizable bullet graphs to your React Native apps.
[](https://www.npmjs.com/package/react-native-bullet-graph)
[](https://www.npmjs.com/package/react-native-bullet-graph)
[](https://www.npmjs.com/package/react-native-macos)
[](https://www.npmjs.com/package/react-native-web)
[](https://github.com/DevVibhor/react-native-bullet-graph/blob/main/CONTRIBUTING.md)
## Gallery 📱
Demo - https://react-native-bullet-graph.web.app/
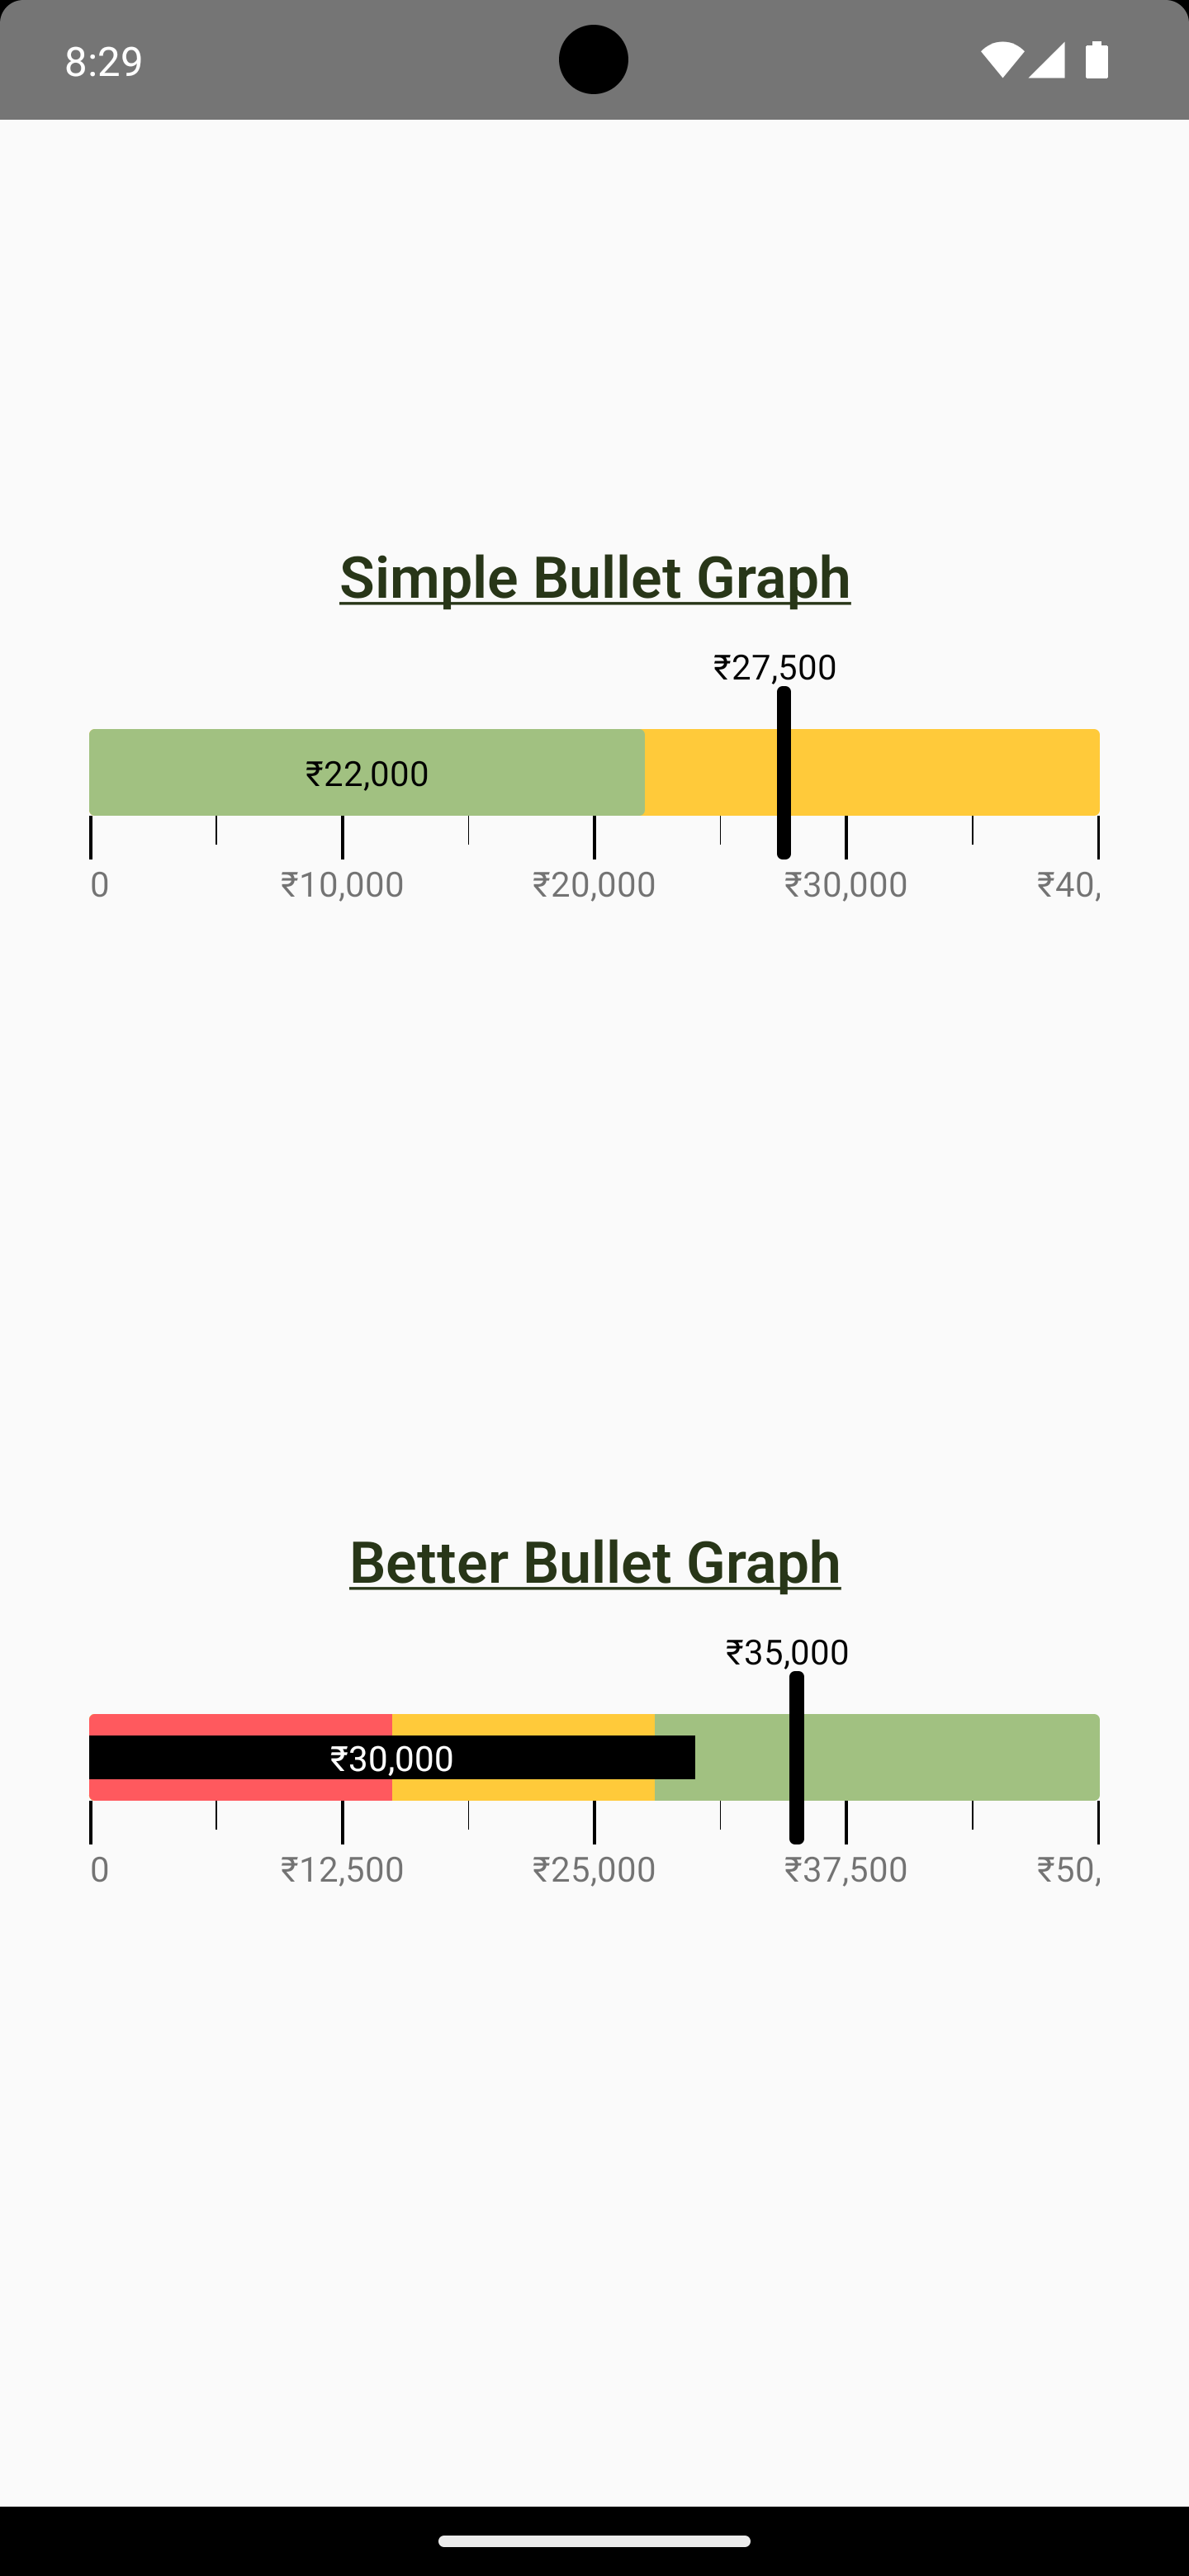
Android
|
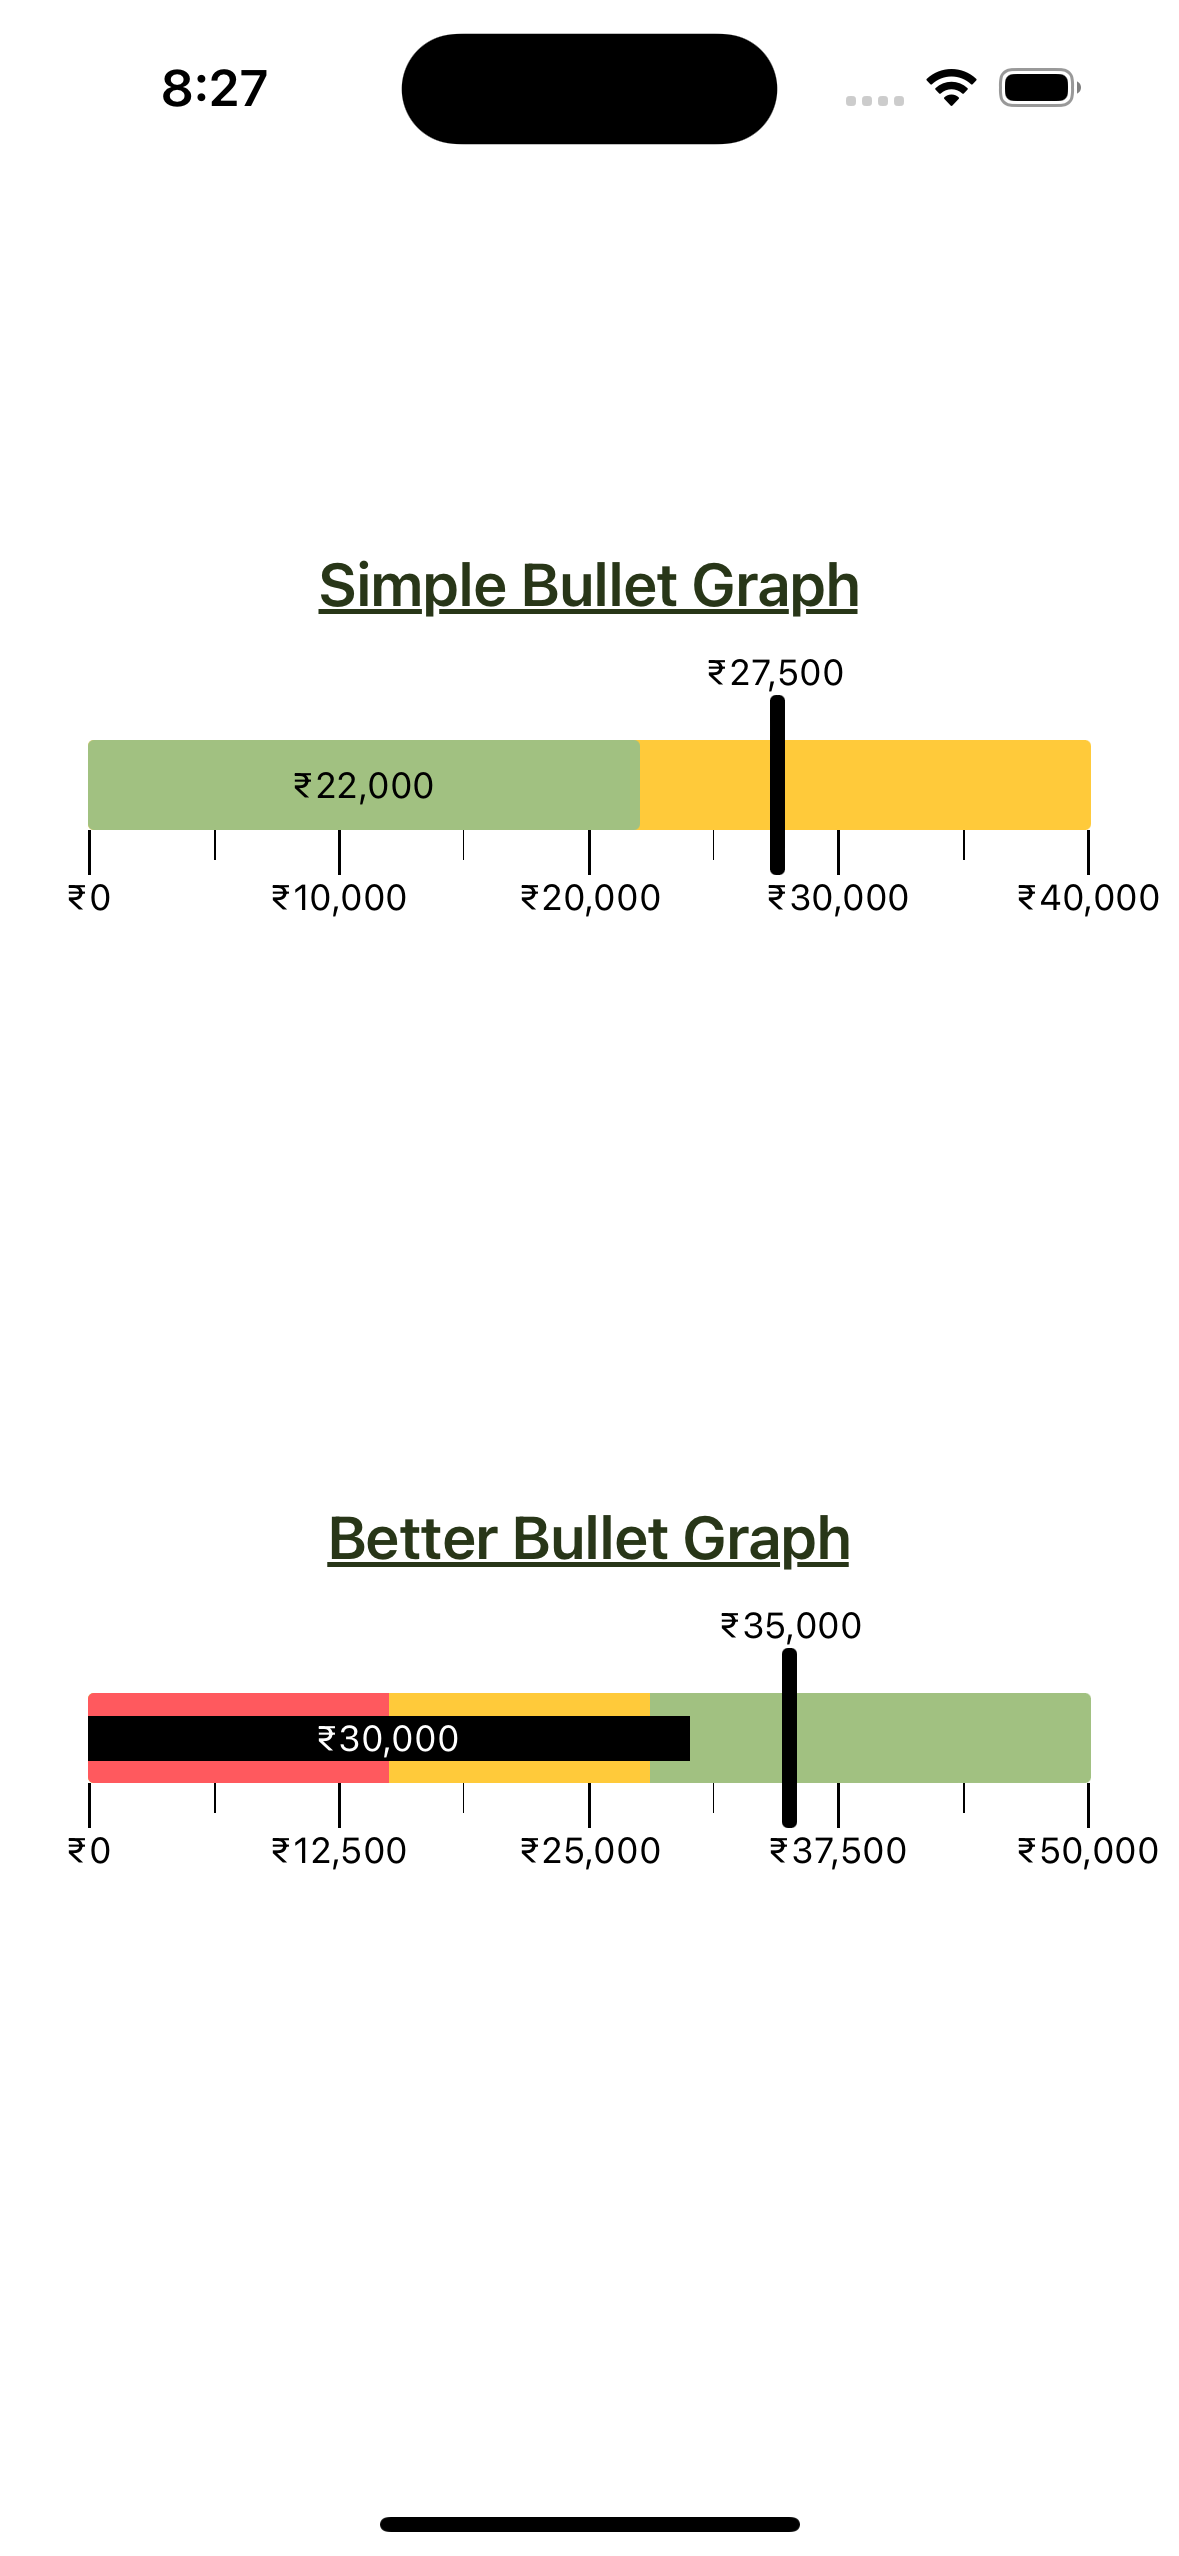
iOS
|
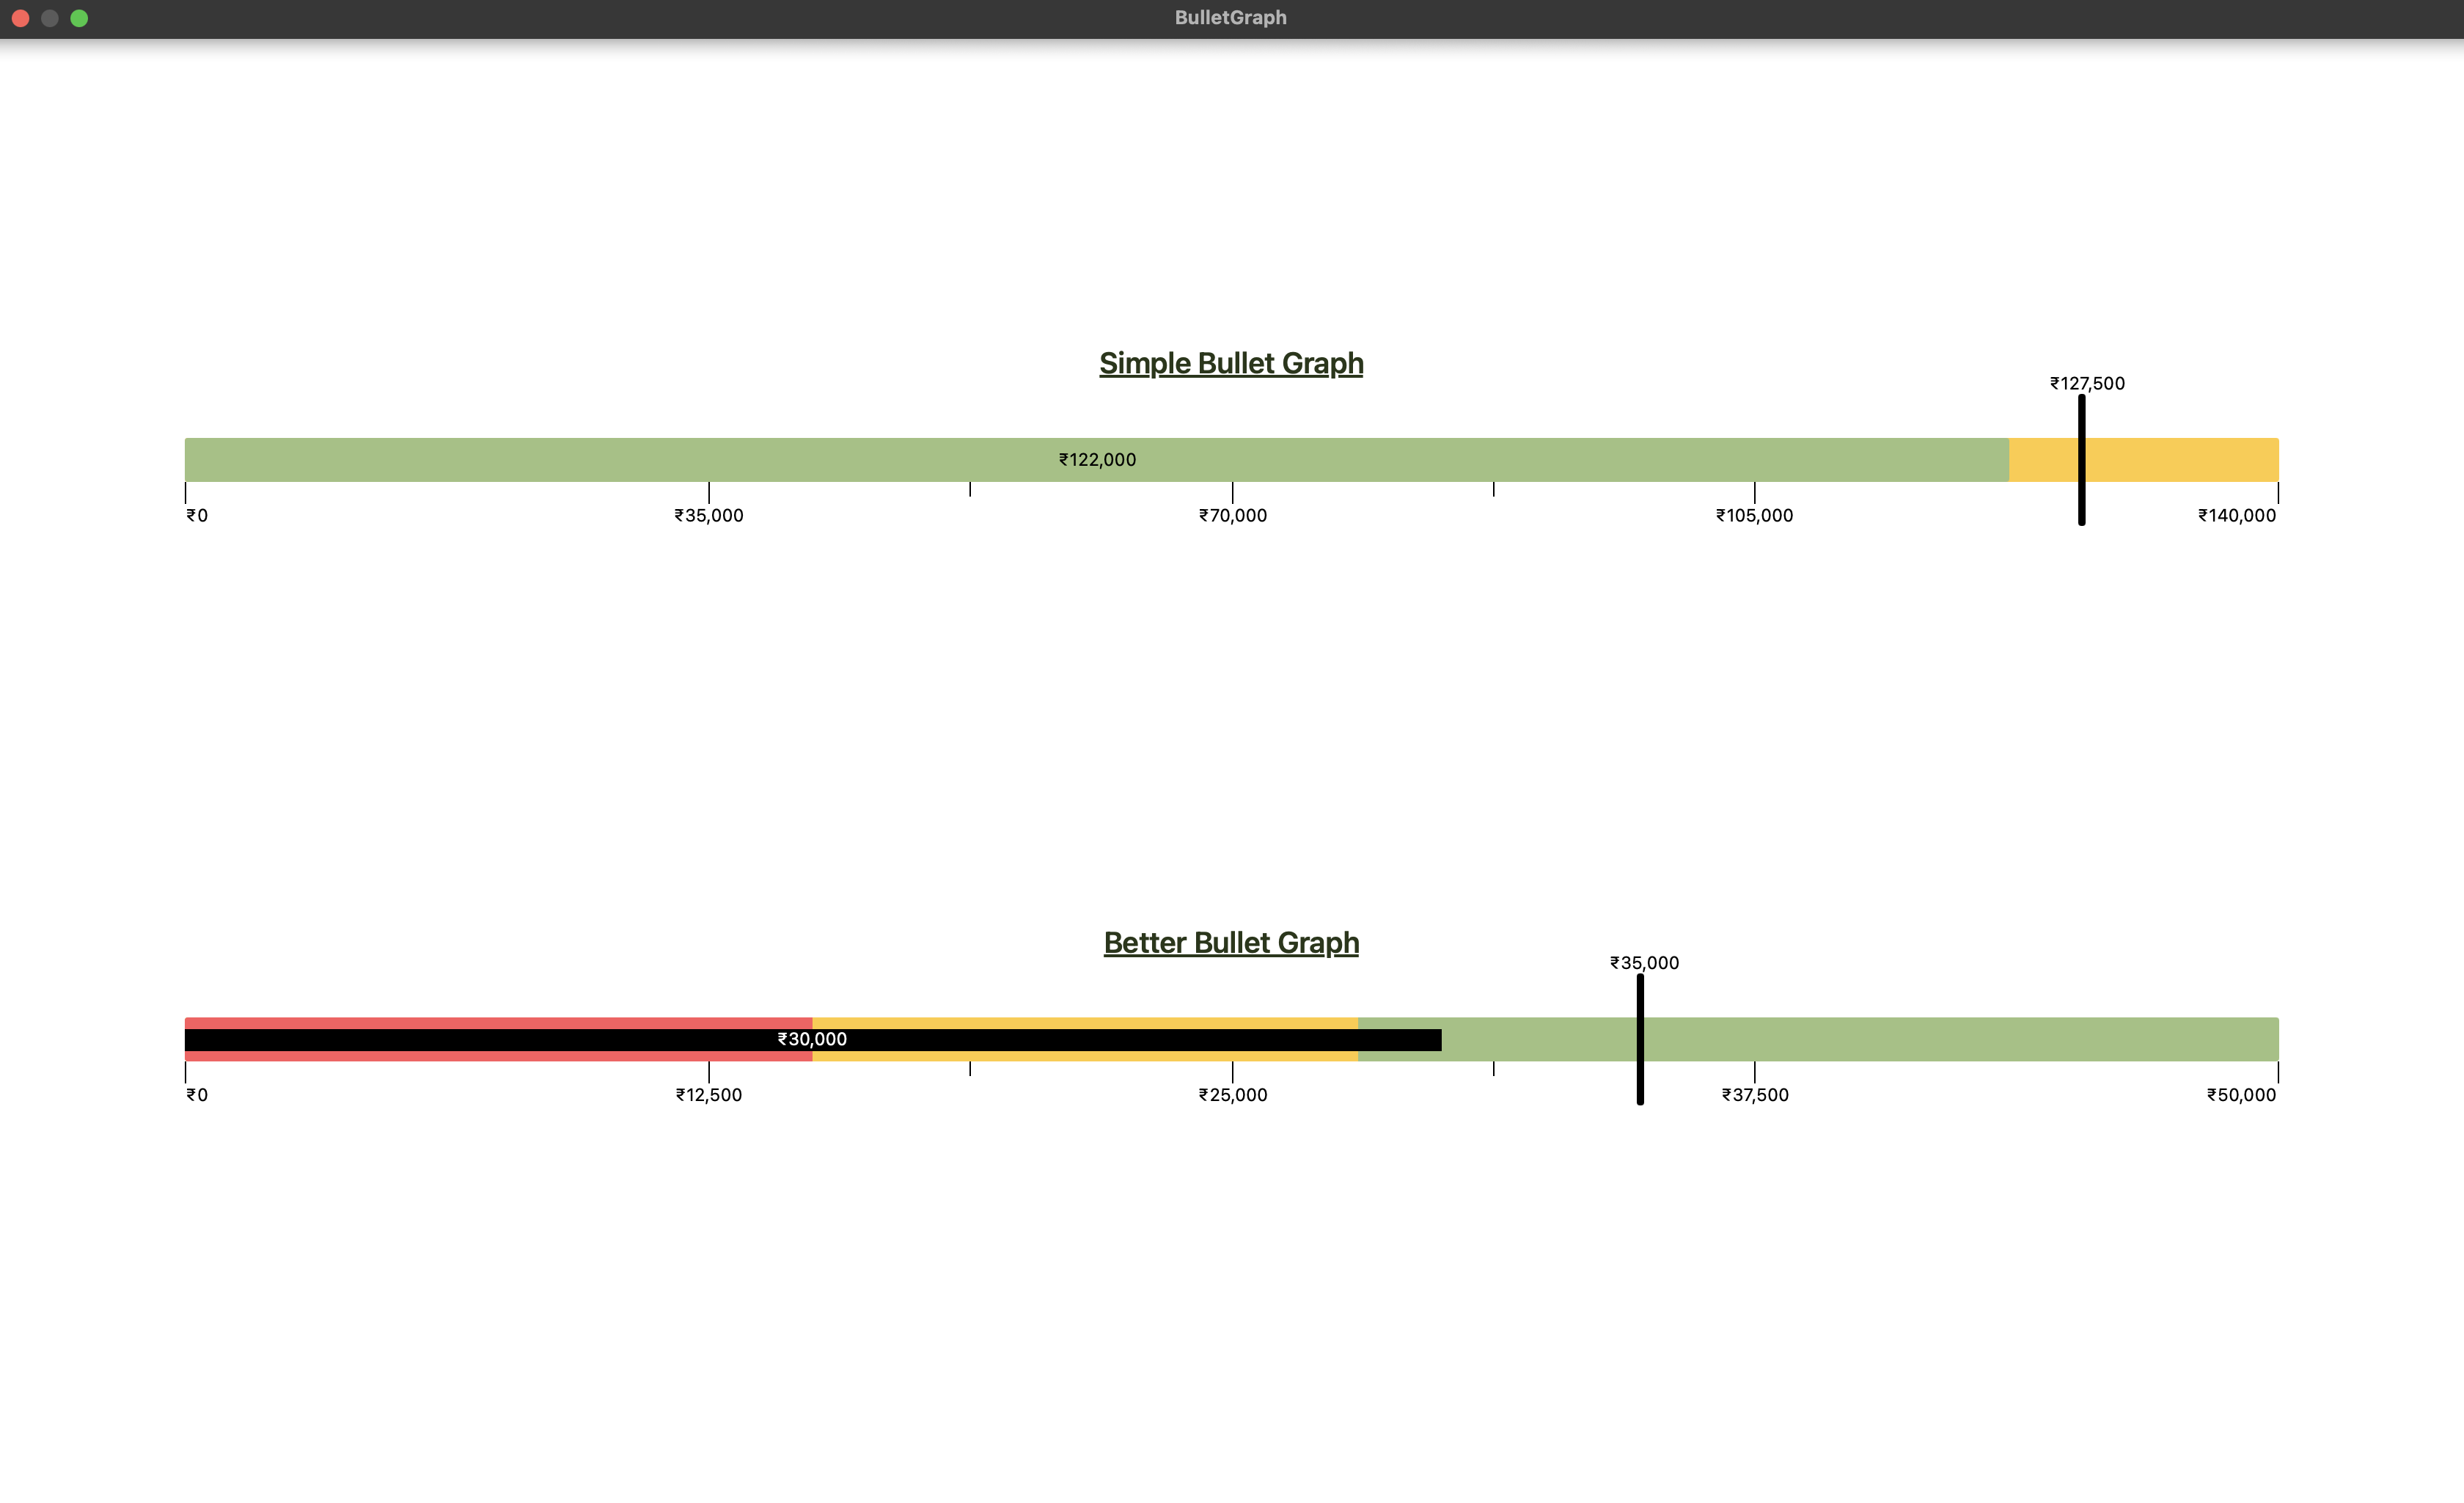
macOS
|
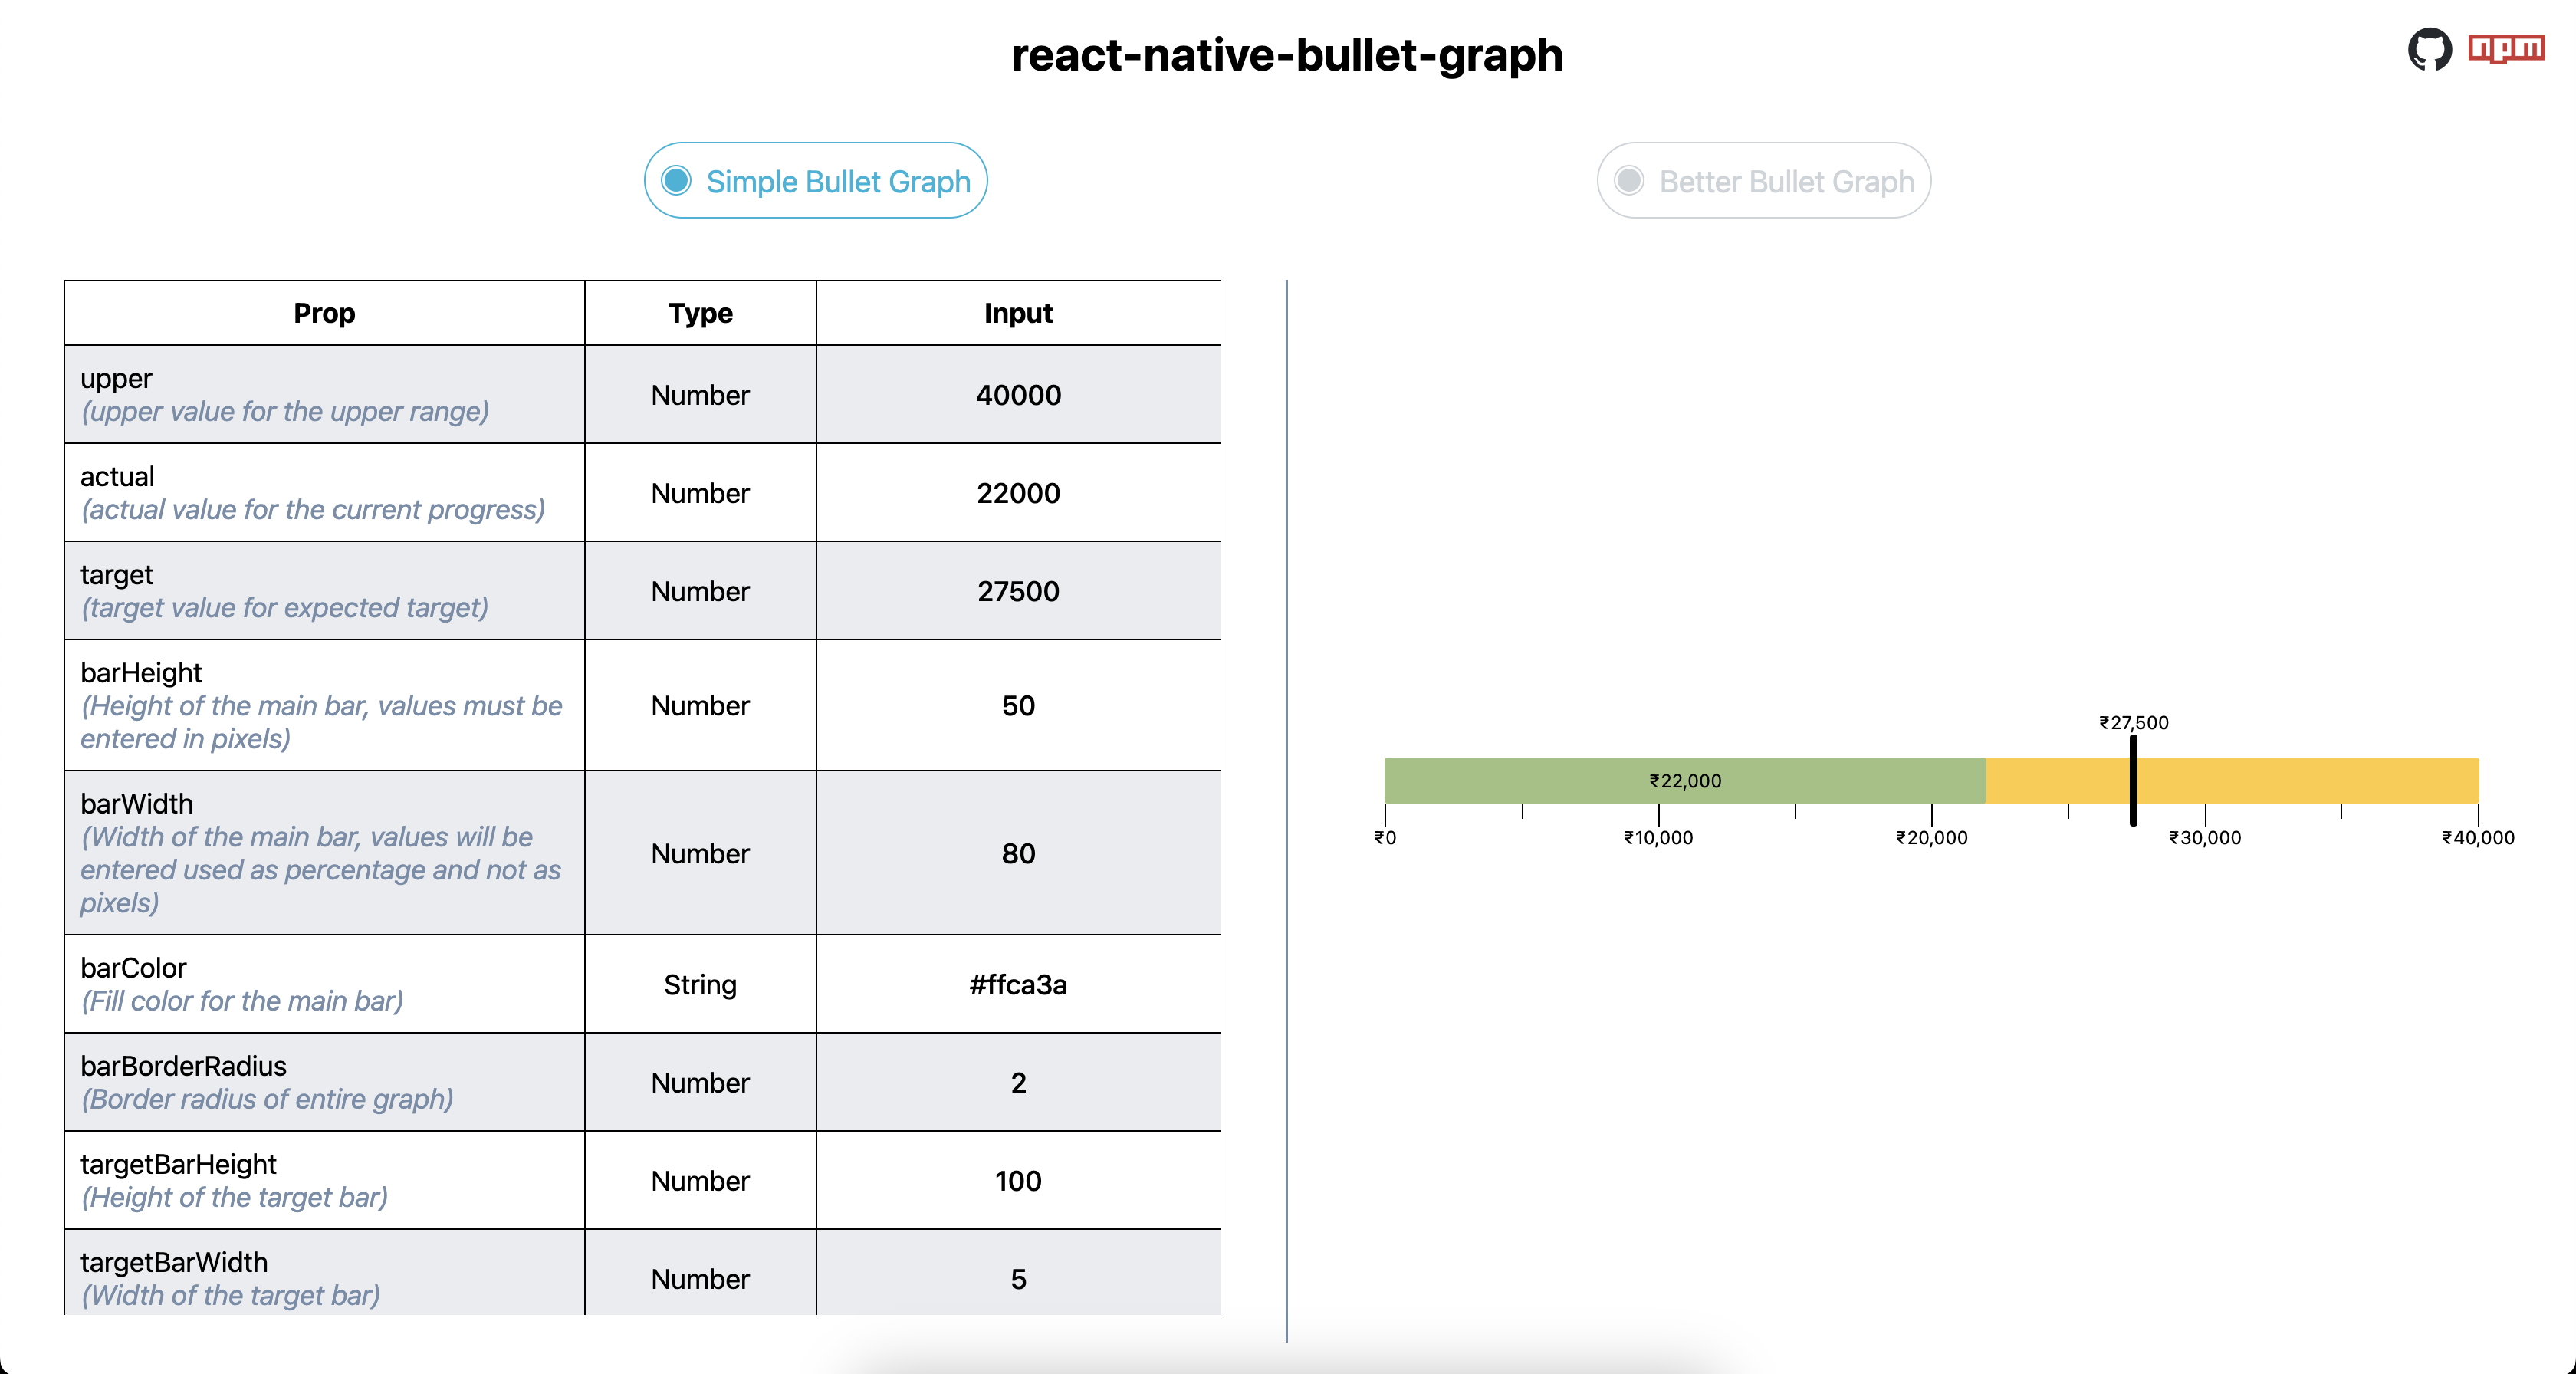
react-native-web
|
## Installation 🚀
```js
npm i react-native-bullet-graph
```
## Usage
Follow the example below to use the graph:
```js
import {
SimpleBulletGraph,
BetterBulletGraph,
} from "react-native-bullet-graph";
// Data required for setup of Simple Bullet Graph
var simpleBulletGraphData = {
upper: 40000, // upper value for the upper range
actual: 22000, // actual value for the current progress
target: 27500, // target value for expected target
};
// Data required for setup of Better Bullet Graph
var betterBulletGraphData = {
upper: 50000,
actual: 30000,
target: 35000,
lower: 15000, // lower value for the bad range
medium: 28000, // medium value for the satisfactory range
};
const App = () => {
return (
<>
);
};
```
## Configuration
Available props to configure the graph according to your needs:
Name | Type | Default value | Description
----------------- |------------------------|-------------------------|--------------
data | `Object` (required) | null | Mandatory data prop which will contain upper, actual and target values
barHeight | `Number` | 20 | Height of the main bar, values must be entered in pixels
barWidth | `Number` | 90 | Width of the main bar, values will be entered used as percentage and not as pixels
barColor | `String` | "#f7b801" | Fill color for the main bar
barBorderRadius | `Number` | 10 | Border radius of entire graph
targetBarHeight | `Number` | 40 | Height of the target bar
targetBarWidth | `Number` | 5 | Width of the target bar
targetBarColor | `String` | "#000000" | Fill color for target bar
targetTextColor | `String` | "#000000" | Text color of the target amount shown on bar
actualBarColor | `String` | "#a1c181" | Fill color for denoting actual progress value
actualTextColor | `String` | "#000000" | Text color of the target amount shown on bar
actualBarHeight | `Number` | 15 | Height of actual bar (Performance Bar)
lowerBarColor | `String` | "#ff595e" | Fill color for the Lower bar (Bad Range)
mediumBarColor | `String` | "#ffca3a" | Fill color for the Medium bar (Satisfactory Range)
numericSize | `Number` | 12 | Font size of target and actual values
timelineFontSize | `Number` | 12 | Font size of timeline values
hideActualValue | `Boolean` | false | Show or hide the actual value shown on bar
hideTargetValue | `Boolean` | false | Show or hide the target value shown on bar
numberPrefix | `String` | null | Prefix value to be added to all values
internationalNumberSystem | `Boolean` | true | 2 or 3 digit comma separator for numeric values
hideScale | `Boolean` | false | Show or hide range scale
scaleColor | `String` | "#000000" | Text and bar color of the scale
## License
MIT