
# TradingChart.js   
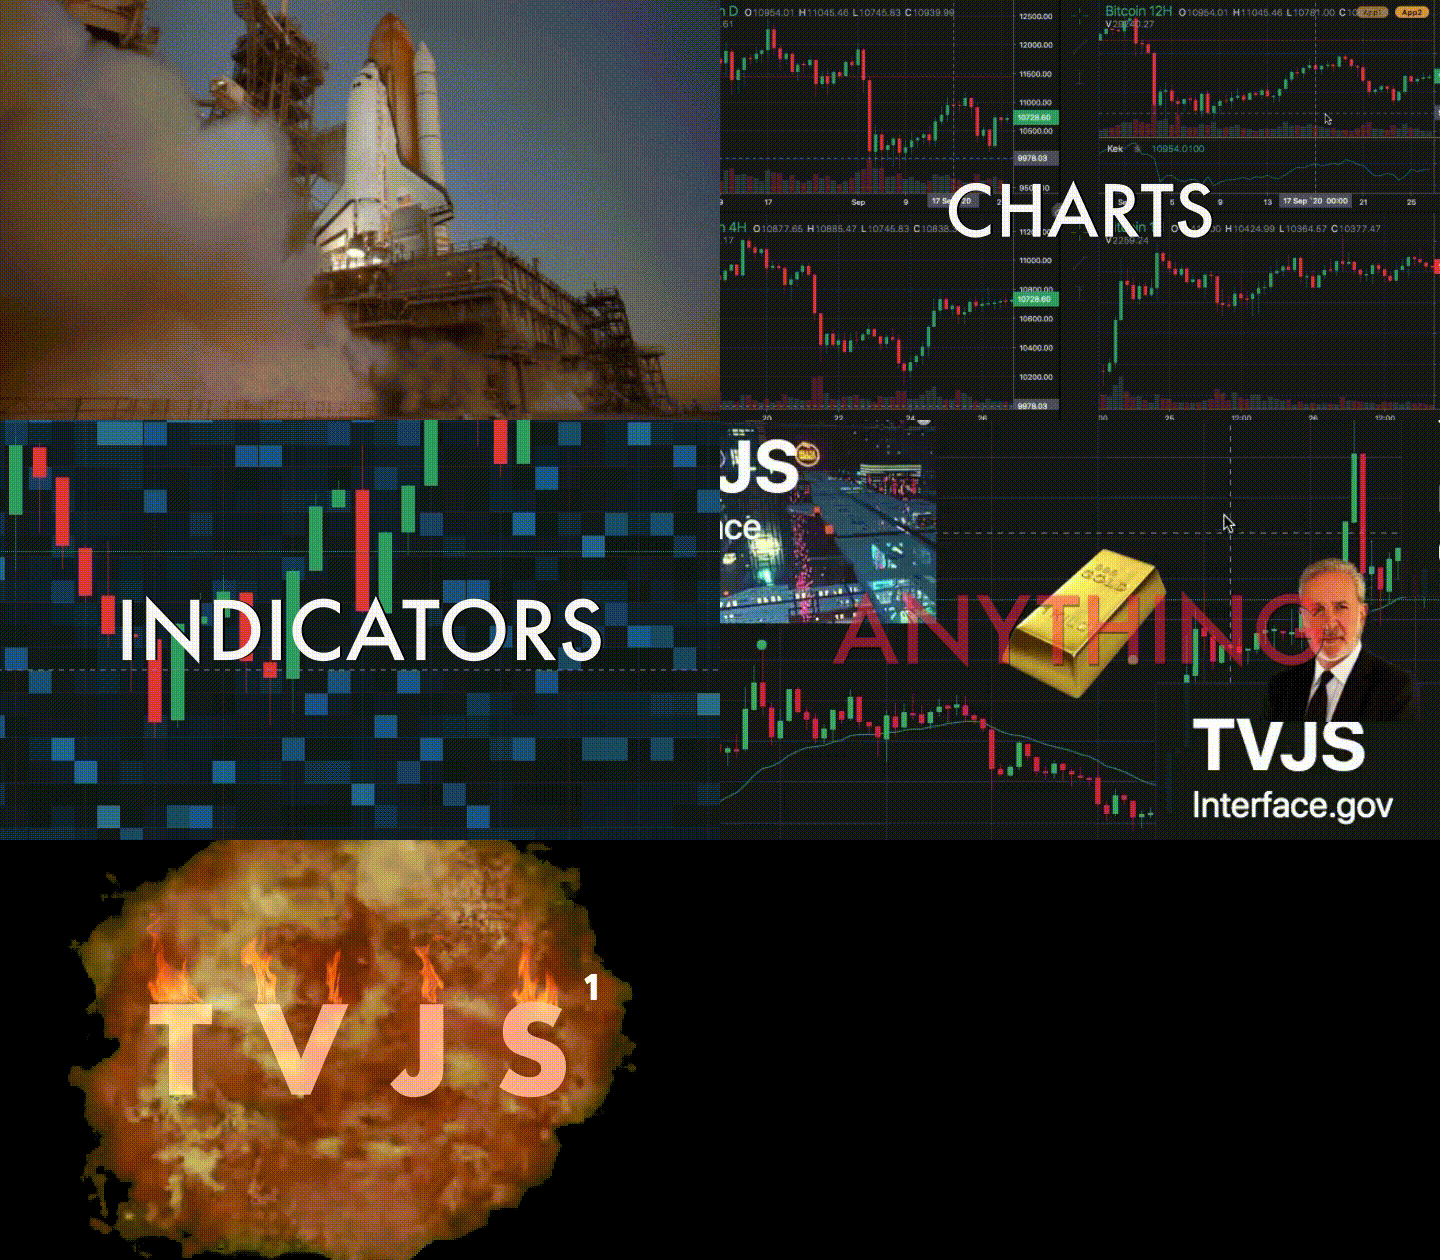
**TradingChart.js** was a hackable charting lib for traders. You could draw literally ANYTHING on top of candlestick charts. [Not Maintained]
## Why
If you create trading software - this lib is probably for you. If you like to make custom indicators and think out of the box - this lib is most likely for you. And if you miss usability of [TradingVue](https://github.com/tvjsx/trading-vue-js) in other open-source libraries and can't stand it - you are definetly in the right place!
## Features
* Scrolling & zooming as we all like
* Simple API for making new overlays
* Custom drawing tools
* Non-time based charts (e.g. Renko)
* One overlay === one .vue component
* Fully reactive
* Fully responsive
* Customizable colors and fonts
* Quite fast (works even with 3 mil candles)
* Scripts (make your own indicators)
## Demo & Docs
### [Getting Started](https://github.com/bsjung/trading-chart-js/tree/master/docs/guide) | [API Book](https://github.com/bsjung/trading-chart-js/tree/master/docs/api#api-book) | [Built-in Overlays](https://github.com/bsjung/trading-chart-js/tree/master/docs/overlays#built-in-overlays) | [Examples](https://github.com/bsjung/trading-chart-js/tree/master/test/tests) | [101 Project](https://github.com/bsjung/trading-chart-101) |[FAQ](https://github.com/bsjung/trading-vue-js/tree/master/docs/faq) | [FREE Overlay Pack](https://github.com/tvjsx/tvjs-overlays) | [Free XP Pack](https://github.com/tvjsx/tvjs-xp) | [Playground](https://tvjs.io/play)
*To run the examples, download the repo & `npm run test`*
## Install
**NPM**
```
npm i trading-vue-js
```
**In browser**
```
```
## How to use
Minimal working example:
```html
```
## Core philosophy
The core philosophy is **Data -> Screen Mapping (DSM)**. The library provides you with functions that map your data (it could be anything) to screen coordinates. The lib does all the dirty work behind the scenes: scrolling, scaling, reactivity, etc.
```
layout.t2screen(t) // time -> x
layout.$2screen($) // price -> y
layout.t_magnet(t) // time -> nearest candle x
layout.screen2$(y) // y -> price
layout.screen2t(x) // x -> time
```
Using these functions and the standard js canvas API, you can do magic.
## Data structure
PRO TIP: **chart** is mandatory if you want to see something other than a white screen
IMPORTANT: All data must be sorted by time (in ascending order). The main OHLCV must not contain duplicate timestamps.
[Full version of DataStructure](https://github.com/tvjsx/trading-vue-js/tree/master/docs/api#data-structure-new)
```js
{
"chart": { // Mandatory
"type": "",
"data": [
[timestamp, open, high, low, close, volume],
...
],
"settings": { } // Settings (depending on Chart Type)
},
"onchart": [ // Displayed ON the chart
{
"name": "",
"type": "",
"data": [
[timestamp, ... ], // Arbitrary length
...
],
"settings": { } // Arbitrary settings format
},
...
],
"offchart": [ // Displayed BELOW the chart
{
"name": "",
"type": "",
"data": [
[timestamp, ... ], // Arbitrary length
...
],
"settings": { } // Arbitrary settings format
},
...
]
}
```
The process of adding a new indicator is simple: first you define your own data format (should be timestamped though) and display settings. For example, EMA data might look like this:
```json
{
"name": "EMA, 25",
"type": "EMA",
"data": [
[ 1551128400000, 3091 ],
[ 1551132000000, 3112 ],
[ 1551135600000, 3105 ]
],
"settings": {
"color": "#42b28a"
}
},
```
## Example of a simple overlay class
And then you make a new overlay class to display that data on the grid:
```js
import { Overlay } from 'trading-vue-js'
export default {
name: 'EMA',
mixins: [Overlay],
methods: {
draw(ctx) {
const layout = this.$props.layout
ctx.strokeStyle = this.color
ctx.beginPath()
for (var p of this.$props.data) {
// t2screen & $2screen - special functions that
// map your data coordinates to grid coordinates
let x = layout.t2screen(p[0])
let y = layout.$2screen(p[1])
ctx.lineTo(x, y)
}
ctx.stroke()
},
use_for() { return ['EMA'] },
data_colors() { return [this.color] }
},
computed: {
color() {
return this.$props.settings.color
}
}
}
```
That's why the title doesn't lie: you can draw ANYTHING.
## Grin
#### [ Code | click your 🐁 ](https://gist.github.com/C451/6d8ea8d603e3faadd801b4b3f2e7a57d)
## Roadmap
* ~~Docs~~
* ~~Tests~~
* ~~Solve known issues (marked as 'TODO: IMPORTANT')~~ [PARTIALLY]
* ~~Performance improvements~~
* ~~Data-manipulation helpers~~
* ~~Add more built-in overlays~~
* ~~Add toolbar (drawing tools)~~
* ~~Custom loayout / layout persistence~~[POST-RELEASE]
* ~~Fix and improve mobile version~~
* **Version 1.0.0 here**
Progress in details: https://github.com/tvjsx/trading-vue-js/projects/1
## Changelog
See CHANGELOG.md
## Development & Building
**Install devDependencies**
```
npm install
```
**Run development enviroment (hot)**
```
npm run dev
```
*Server is running on http://localhost:8080*
**Run in a CDN-like mode**
```
npm run cdn
```
*Server is running on http://localhost:8080*
**Build the bundle**
```
npm run build
```
**Visual testing**
```
npm run test
```
*Server is running on http://localhost:8080*
**Automatic testing**
```
npm run auto-test
```
## Contributing
1. Fork ( https://github.com/tvjsx/trading-vue-js/fork )
2. Create your feature branch (`git checkout -b cool-new-feature`)
3. Commit your changes (`git commit -am 'Let's rock smth'`)
4. Push to the branch (`git push origin cool-new-feature`)
5. Create a new Pull Request
Please read the guidelines in CONTRIBUTING.md
