# Value-Suppressing Uncertainty Palettes (VSUPs)
[](https://www.npmjs.com/package/vsup)
[](https://travis-ci.org/uwdata/vsup)
Code for generating Value-Suppressing Uncertainty Palettes for use in D3 charts. You can find the [research paper about VSUPs on our website](http://idl.cs.washington.edu/papers/uncertainty-palettes).
## Examples
These examples are served from the [`examples`](https://github.com/uwdata/vsup/tree/master/examples) directory.
* Flights: https://uwdata.github.io/vsup/examples/flights.html
* Polling: https://uwdata.github.io/vsup/examples/polling.html
* Virology: https://uwdata.github.io/vsup/examples/virology.html
## Citation
If you use this module for a publication, please cite VSUPs as:
```bib
@inproceedings{2018-uncertainty-palettes,
title = {Value-Suppressing Uncertainty Palettes},
author = {Michael Correll AND Dominik Moritz AND Jeffrey Heer},
booktitle = {ACM Human Factors in Computing Systems (CHI)},
year = {2018},
url = {http://idl.cs.washington.edu/papers/uncertainty-palettes},
}
```
## Installation
`yarn add vsup` or include the library directly from [jsdelivr](https://www.jsdelivr.com/package/npm/vsup) as [`https://cdn.jsdelivr.net/npm/vsup`](https://cdn.jsdelivr.net/npm/vsup).
## Usage
### Quantization [<>](https://github.com/uwdata/vsup/blob/master/src/quantization.js)
A quantization defines how values or objects of the form `{u: number, v: number}` (uncertainty and value) are quantized. They are used instead of a domain in VSUP scales.
This module supports three different quantizations: `linearQuantization`, `squareQuantization`, and `quantization`.
#### `vsup.linearQuantization`
This is a wrapper around [`d3.scaleQuantize`](https://github.com/d3/d3-scale#quantize-scales).
#### `vsup.squareQuantization`
Defines a quantization into a rectangular matrix of value and uncertainty.
The constructor takes a single argument `n`, the number of rows and columns.
```js
var q = vsup.squareQuantization(3);
```
`q` is then a function that can be used to discretize uncertainties and values.
```js
> q(0.2,0.1);
{u: 0, v: 0.16666666666666666}
```
The quantization has the following methods:
* `range`
* `n`
* `matrix`
* `data`
* `uncertaintyDomain`
* `valueDomain`
#### `vsup.quantization`
Similar to `squareQuantization` but creates a tree quantization. The constructor takes two arguments `branchingFactor` and `treeLayers`.
The quantization has the following methods:
* `range`
* `branching`
* `layers`
* `tree`
* `data`
* `uncertaintyDomain`
* `valueDomain`
### Scales [<>](https://github.com/uwdata/vsup/blob/master/src/scale.js)
The interface to create a scale mirrors [scales in D3](https://github.com/d3/d3-scale). The difference of VSUP scales is that they use a quantization instead of a domain. The range can be set to any color range.
The constructor takes three optional arguments: mode (`usl`, `us`, `ul`), range, and quantization. It returns a function that takes two arguments `value` and `uncertainty`.
For example
```js
var s = vsup.scale();
```
`s` is now a function that takes two arguments
```js
> s(0.8, 0.1);
"rgb(137, 214, 99)"
```
The scale has the following methods:
* `range` to get or set the color range (e.g. `d3.interpolateViridis`)
* `colorList`
* `colorDists`
* `mode`
* `quantize`
### Legends [<>](https://github.com/uwdata/vsup/blob/master/src/legend.js)
This module implements three kinds of legends (`simpleLegend`, `heatmapLegend`, and `arcmapLegend`) corresponding to the three quantization types.
To add a legend to the DOM, create a legend and attach it to an element. For example:
```js
var legend = vsup.legend().arcmapLegend();
svg.append("g").call(legend)
```
You can find example code in [`test/legend.html`](https://github.com/uwdata/vsup/blob/master/test/legend.html).
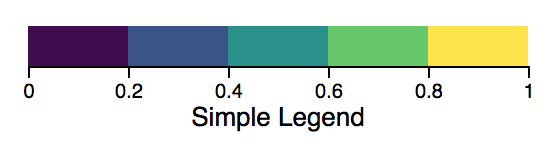
#### `vsup.legend.simpleLegend`
A simple legend for linear quantizations.
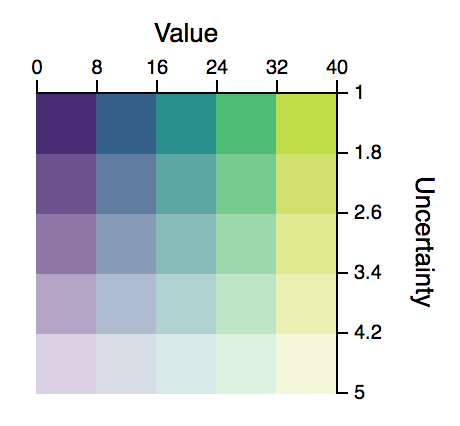
#### `vsup.legend.heatmapLegend`
A rectangular legend for tree quantization or square quantization.
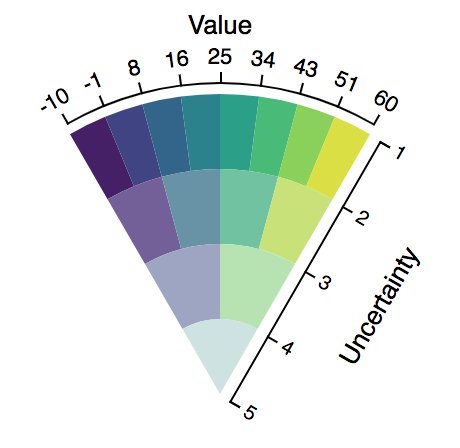
#### `vsup.legend.arcmapLegend`
A legend for a tree quantization.
## Developers
### Make a new release
* Test the examples in `test`
* `yarn version`
* `npm publish`
* `git push --tags`