
Vue ECharts
Apache ECharts™ 的 Vue.js 组件。



> 还在使用 Vue 2?可以继续阅读老版本的文档。[前往 →](https://github.com/ecomfe/vue-echarts/blob/7.x/README.zh-Hans.md)
## 安装 & 使用
### npm
```sh
npm install echarts vue-echarts
```
#### 示例
Demo →
```vue
```
> [!IMPORTANT]
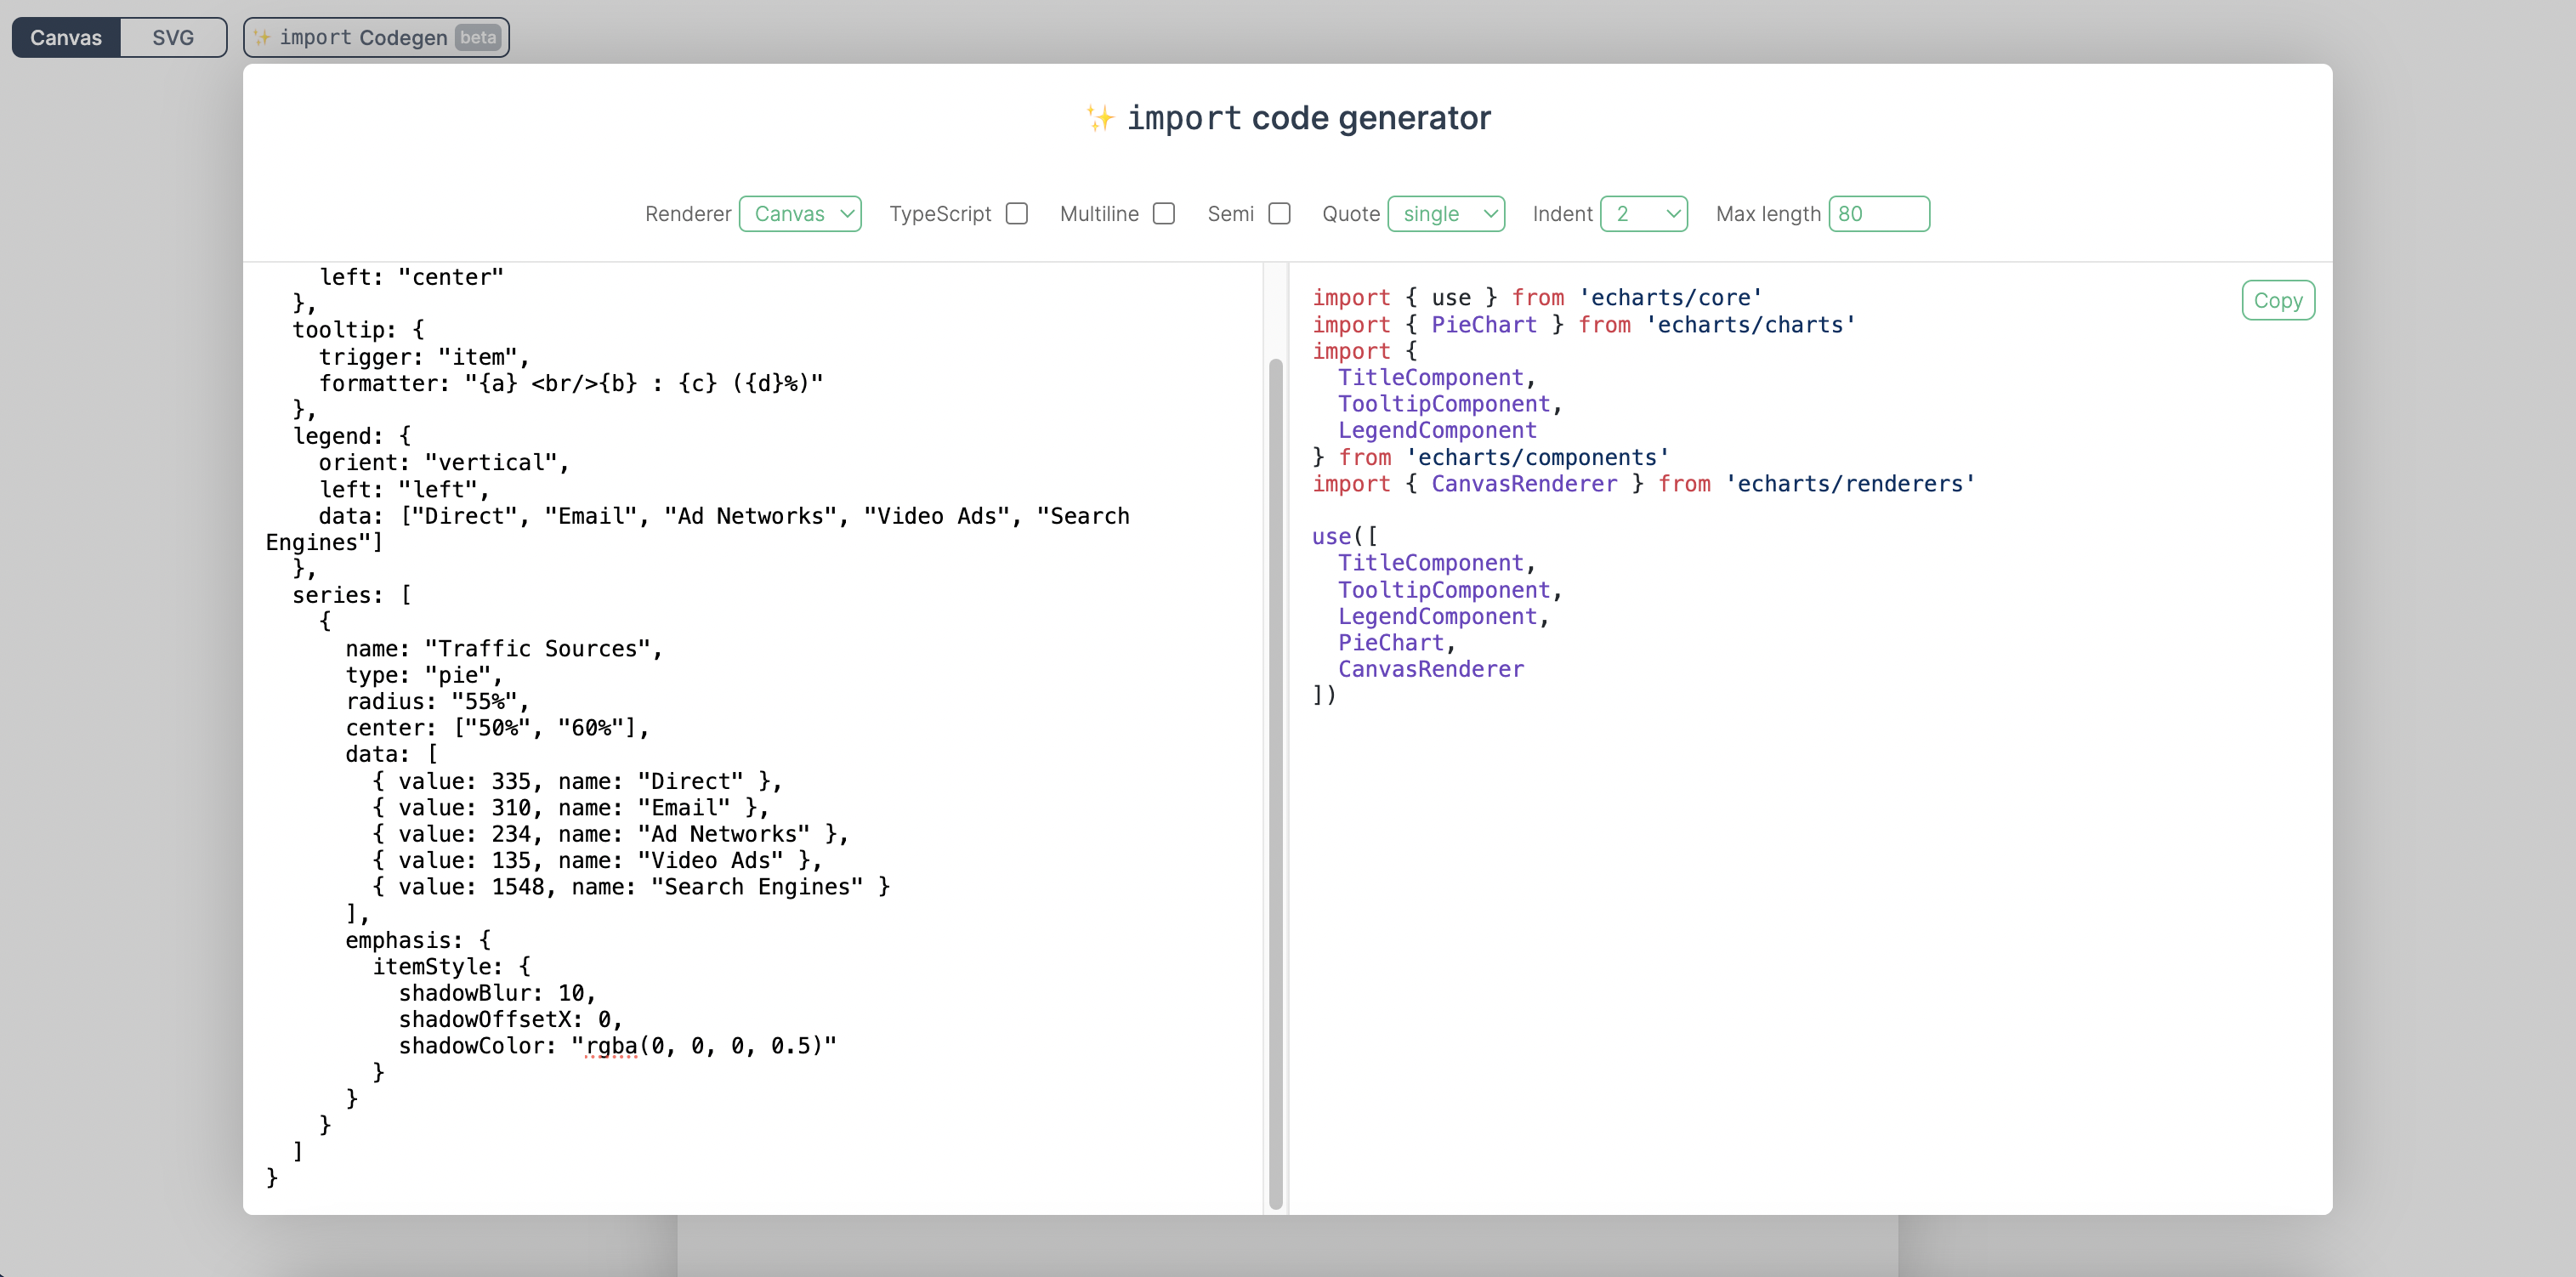
> 我们鼓励手动从 ECharts 中引入组件和图表,以减小打包体积。我们已经为此构建了一个[导入代码生成器](https://vue-echarts.dev/#codegen)。你只需要把`option` 代码粘贴进去,就可以得到精确的导入代码。
>
> 
>
> [试一试 →](https://vue-echarts.dev/#codegen)
但如果你实在需要全量引入 ECharts 从而无需手动引入模块,只需要在代码中添加:
```js
import "echarts";
```
### CDN
用如下方式在 HTML 中插入 `
```
```js
const app = Vue.createApp(...)
// 全局注册组件(也可以使用局部注册)
app.component('VChart', VueECharts)
```
可以在[这里](https://github.com/ecomfe/vue-echarts/tree/main/demo)查看更多例子。
### Prop
- `init-options: object`
初始化附加参数。请参考 `echarts.init` 的 `opts` 参数。[前往 →](https://echarts.apache.org/zh/api.html#echarts.init)
Inject 键名:`INIT_OPTIONS_KEY`。
- `theme: string | object`
要应用的主题。请参考 `echarts.init` 的 `theme` 参数。[前往 →](https://echarts.apache.org/zh/api.html#echarts.init)
Inject 键名:`THEME_KEY`。
- `option: object`
ECharts 的万能接口。修改这个 prop 会触发 ECharts 实例的 `setOption` 方法。查看[详情 →](https://echarts.apache.org/zh/option.html)
#### 智能更新
- 如果提供了 `update-options`(或通过 inject 注入),Vue ECharts 会直接把它传给 `setOption`,不会执行智能计划。
- 手动调用 `setOption`(仅当 `manual-update` 为 `true` 时可用)与原生 ECharts 保持一致,只使用本次调用传入的参数,重新初始化后不会保留这些调用的效果。
- 其他情况下,Vue ECharts 会分析差异:删除的对象写入 `null`,删除的数组写入 `[]` 并加入 `replaceMerge`,ID/匿名项减少时追加 `replaceMerge`,风险较高的变更会退回 `notMerge: true`。
- `update-options: object`
图表更新的配置项。一旦提供(或通过 inject 注入),Vue ECharts 会直接把它传给 `setOption` 并跳过智能更新。请参考 `echartsInstance.setOption` 的 `opts` 参数。[前往 →](https://echarts.apache.org/zh/api.html#echartsInstance.setOption)
Inject 键名:`UPDATE_OPTIONS_KEY`。
- `group: string`
图表的分组,用于[联动](https://echarts.apache.org/zh/api.html#echarts.connect)。请参考 `echartsInstance.group`。[前往 →](https://echarts.apache.org/zh/api.html#echartsInstance.group)
- `autoresize: boolean | { throttle?: number, onResize?: () => void }`(默认值`false`)
图表在组件根元素尺寸变化时是否需要自动进行重绘。也可以传入一个选项对象来指定自定义的节流延迟和尺寸变化时的额外回调函数。
- `loading: boolean`(默认值:`false`)
图表是否处于加载状态。
- `loading-options: object`
加载动画配置项。请参考 `echartsInstance.showLoading` 的 `opts` 参数。[前往 →](https://echarts.apache.org/zh/api.html#echartsInstance.showLoading)
Inject 键名:`LOADING_OPTIONS_KEY`。
- `manual-update: boolean`(默认值 `false`)
适用于性能敏感的场景(例如 `option` 很大或更新频繁)。设为 `true` 时,`option` 只参与首次渲染,后续的 prop 变更不会触发图表更新,需要你通过模板 `ref` 手动调用 `setOption`。如果图表因为修改 `init-options`、切换 `manual-update` 或重新挂载而被重新初始化,之前通过 `setOption` 写入的状态会丢失,并重新使用当前的 `option` 值渲染。
### 事件
可以使用 Vue 的 `v-on` 指令绑定事件。
```vue
```
> [!NOTE]
> 仅支持 `.once` 修饰符,因为其它修饰符都与 DOM 事件机制强耦合。
Vue ECharts 支持如下事件:
- `highlight` [→](https://echarts.apache.org/zh/api.html#events.highlight)
- `downplay` [→](https://echarts.apache.org/zh/api.html#events.downplay)
- `selectchanged` [→](https://echarts.apache.org/zh/api.html#events.selectchanged)
- `legendselectchanged` [→](https://echarts.apache.org/zh/api.html#events.legendselectchanged)
- `legendselected` [→](https://echarts.apache.org/zh/api.html#events.legendselected)
- `legendunselected` [→](https://echarts.apache.org/zh/api.html#events.legendunselected)
- `legendselectall` [→](https://echarts.apache.org/zh/api.html#events.legendselectall)
- `legendinverseselect` [→](https://echarts.apache.org/zh/api.html#events.legendinverseselect)
- `legendscroll` [→](https://echarts.apache.org/zh/api.html#events.legendscroll)
- `datazoom` [→](https://echarts.apache.org/zh/api.html#events.datazoom)
- `datarangeselected` [→](https://echarts.apache.org/zh/api.html#events.datarangeselected)
- `timelinechanged` [→](https://echarts.apache.org/zh/api.html#events.timelinechanged)
- `timelineplaychanged` [→](https://echarts.apache.org/zh/api.html#events.timelineplaychanged)
- `restore` [→](https://echarts.apache.org/zh/api.html#events.restore)
- `dataviewchanged` [→](https://echarts.apache.org/zh/api.html#events.dataviewchanged)
- `magictypechanged` [→](https://echarts.apache.org/zh/api.html#events.magictypechanged)
- `geoselectchanged` [→](https://echarts.apache.org/zh/api.html#events.geoselectchanged)
- `geoselected` [→](https://echarts.apache.org/zh/api.html#events.geoselected)
- `geounselected` [→](https://echarts.apache.org/zh/api.html#events.geounselected)
- `axisareaselected` [→](https://echarts.apache.org/zh/api.html#events.axisareaselected)
- `brush` [→](https://echarts.apache.org/zh/api.html#events.brush)
- `brushEnd` [→](https://echarts.apache.org/zh/api.html#events.brushEnd)
- `brushselected` [→](https://echarts.apache.org/zh/api.html#events.brushselected)
- `globalcursortaken` [→](https://echarts.apache.org/zh/api.html#events.globalcursortaken)
- `rendered` [→](https://echarts.apache.org/zh/api.html#events.rendered)
- `finished` [→](https://echarts.apache.org/zh/api.html#events.finished)
- 鼠标事件
- `click` [→](https://echarts.apache.org/zh/api.html#events.Mouse%20events.click)
- `dblclick` [→](https://echarts.apache.org/zh/api.html#events.Mouse%20events.dblclick)
- `mouseover` [→](https://echarts.apache.org/zh/api.html#events.Mouse%20events.mouseover)
- `mouseout` [→](https://echarts.apache.org/zh/api.html#events.Mouse%20events.mouseout)
- `mousemove` [→](https://echarts.apache.org/zh/api.html#events.Mouse%20events.mousemove)
- `mousedown` [→](https://echarts.apache.org/zh/api.html#events.Mouse%20events.mousedown)
- `mouseup` [→](https://echarts.apache.org/zh/api.html#events.Mouse%20events.mouseup)
- `globalout` [→](https://echarts.apache.org/zh/api.html#events.Mouse%20events.globalout)
- `contextmenu` [→](https://echarts.apache.org/zh/api.html#events.Mouse%20events.contextmenu)
- ZRender 事件
- `zr:click`
- `zr:mousedown`
- `zr:mouseup`
- `zr:mousewheel`
- `zr:dblclick`
- `zr:contextmenu`
更多事件说明可参考 [ECharts 官方事件文档 →](https://echarts.apache.org/zh/api.html#events)
#### 原生 DOM 事件
由于 Vue ECharts 默认将事件绑定到 ECharts 实例,因此在使用原生 DOM 事件时需要做一些特殊处理。你需要在事件名称前加上 `native:` 前缀来绑定原生 DOM 事件。
```vue
```
### Provide / Inject
Vue ECharts 为 `theme`、`init-options`、`update-options` 和 `loading-options` 提供了 provide/inject API,以通过上下文配置选项。例如:可以通过如下方式来使用 provide API 为 `theme` 提供上下文配置:
组合式 API
```js
import { THEME_KEY } from "vue-echarts";
import { provide } from "vue";
provide(THEME_KEY, "dark");
// 或者 provide 一个 ref
const theme = ref("dark");
provide(THEME_KEY, theme);
// 也支持 getter
provide(THEME_KEY, () => theme.value);
```
选项式 API
```js
import { THEME_KEY } from 'vue-echarts'
import { computed } from 'vue'
export default {
{
provide: {
[THEME_KEY]: 'dark'
}
}
}
// 或者让注入项具有响应性
export default {
data() {
return {
theme: 'dark'
}
},
provide() {
return {
[THEME_KEY]: computed(() => this.theme)
}
}
}
```
### 方法
- `setOption` [→](https://echarts.apache.org/zh/api.html#echartsInstance.setOption)
- `getWidth` [→](https://echarts.apache.org/zh/api.html#echartsInstance.getWidth)
- `getHeight` [→](https://echarts.apache.org/zh/api.html#echartsInstance.getHeight)
- `getDom` [→](https://echarts.apache.org/zh/api.html#echartsInstance.getDom)
- `getOption` [→](https://echarts.apache.org/zh/api.html#echartsInstance.getOption)
- `resize` [→](https://echarts.apache.org/zh/api.html#echartsInstance.resize)
- `dispatchAction` [→](https://echarts.apache.org/zh/api.html#echartsInstance.dispatchAction)
- `convertToPixel` [→](https://echarts.apache.org/zh/api.html#echartsInstance.convertToPixel)
- `convertFromPixel` [→](https://echarts.apache.org/zh/api.html#echartsInstance.convertFromPixel)
- `containPixel` [→](https://echarts.apache.org/zh/api.html#echartsInstance.containPixel)
- `getDataURL` [→](https://echarts.apache.org/zh/api.html#echartsInstance.getDataURL)
- `getConnectedDataURL` [→](https://echarts.apache.org/zh/api.html#echartsInstance.getConnectedDataURL)
- `clear` [→](https://echarts.apache.org/zh/api.html#echartsInstance.clear)
- `dispose` [→](https://echarts.apache.org/zh/api.html#echartsInstance.dispose)
> [!NOTE]
> 如下 ECharts 实例方法没有被暴露,因为它们的功能已经通过组件 [prop](#props) 提供了:
>
> - [`showLoading`](https://echarts.apache.org/zh/api.html#echartsInstance.showLoading) / [`hideLoading`](https://echarts.apache.org/zh/api.html#echartsInstance.hideLoading):请使用 `loading` 和 `loading-options` prop。
> - [`setTheme`](https://echarts.apache.org/zh/api.html#echartsInstance.setTheme):请使用 `theme` prop。
### 插槽(Slots)
Vue ECharts 允许你通过 Vue 插槽来定义 ECharts 配置中的 [`tooltip.formatter`](https://echarts.apache.org/zh/option.html#tooltip.formatter) 和 [`toolbox.feature.dataView.optionToContent`](https://echarts.apache.org/zh/option.html#toolbox.feature.dataView.optionToContent) 回调,而无需在 `option` 对象中定义它们。你可以使用熟悉的 Vue 模板语法来编写自定义提示框或数据视图中的内容。
#### 插槽命名约定
- 插槽名称以 `tooltip`/`dataView` 开头,后面跟随用连字符分隔的路径片段,用于定位目标。
- 每个路径片段对应 `option` 对象的属性名或数组索引(数组索引使用数字形式)。
- 拼接后的插槽名称直接映射到要覆盖的嵌套回调函数。
**示例映射**:
- `tooltip` → `option.tooltip.formatter`
- `tooltip-baseOption` → `option.baseOption.tooltip.formatter`
- `tooltip-xAxis-1` → `option.xAxis[1].tooltip.formatter`
- `tooltip-series-2-data-4` → `option.series[2].data[4].tooltip.formatter`
- `dataView` → `option.toolbox.feature.dataView.optionToContent`
- `dataView-media-1-option` → `option.media[1].option.toolbox.feature.dataView.optionToContent`
插槽的 props 对象对应回调函数的第一个参数。
用法示例
```vue
{{ param.seriesName }}
{{ param.value[0] }}
X轴: {{ params.value }}
|
{{ t }}
|
| {{ row[0] }} |
{{ v }} |
```
[示例 →](https://vue-echarts.dev/#line)
> [!NOTE]
> 插槽会优先于 `props.option` 中对应的回调函数。
### 静态方法
静态方法请直接通过 [`echarts` 本身](https://echarts.apache.org/zh/api.html#echarts)进行调用。
## CSP: `style-src` 或 `style-src-elem`
如果你执行严格的 CSP 策略来防止内联 `